Dot Densifying a Canadian City

By way of a warm up to future blogging pleasures, I thought I’d post some mapping work I did for actual fun last year. As Christmas gifts for family I decided to make some custom maps of Winnipeg, Canada (location not chosen randomly, they’re actually from there).

Don’t know Winnipeg? Well… It’s a city of nearly 700000 in the middle of North America, it has a big ice hockey team, and it gets blooooooddy cold in the Winter. My extensive research also seemed to suggest that Winnipeg doesn’t get its fair share of nice city maps – that needs to change.

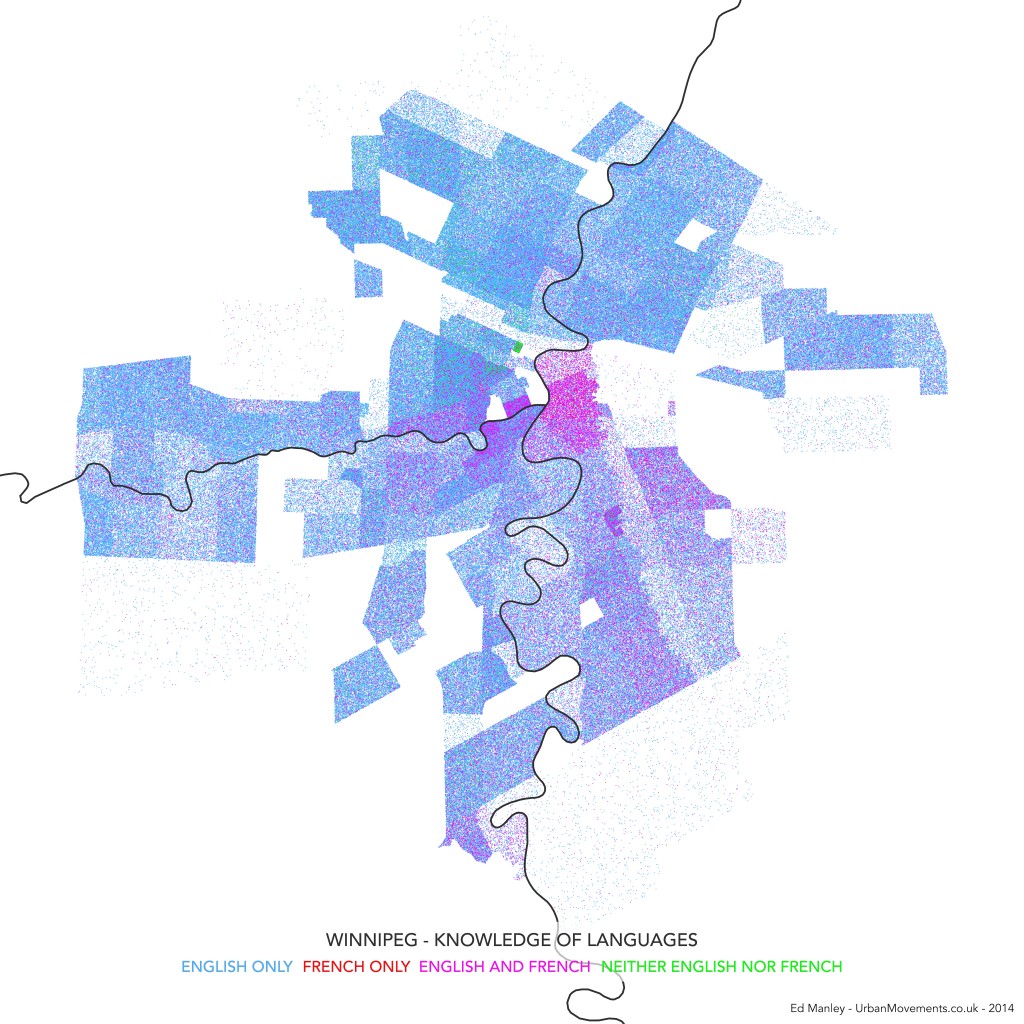
Like many North American cities, walking around Winnipeg you get a sense of how the city starkly changes from neighbourhood to neighbourhood. Winnipeg contains the largest urban population of Native Canadians in Canada, with the community strongly concentrated near to Downtown and northern suburbs. There is a historic French speaking region too, named St Boniface, and a small Chinatown, both near to central Winnipeg. Capturing this diversity (and division) was one of my aims from the start.

Open Data and Open Mapping

It turns out that Winnipeg has a decent supply of Open City Data. It has an Open Data portal – data.winnipeg.ca – based on the useful Socrata platform, as well as a live transit data API. Looking through the available datasets, although it was pretty tempting to make a map of ‘sewer backups’ (nice) or reports of graffiti, someone had done a pretty good job of organising neighbourhood-level 2006 Census data. These datasets were well organised and appeared to provide rich information relating to local demographic variation.

In terms of the map format, my first instinct was to turn to dot density mapping. Dot density maps use multiple points to indicate the categorisation and density of features (e.g. some things) within a region. These maps are often used to map Census statistics, where single points equate to actual individuals. For each Census area, you generate points for the population in the area – you have 500 people, you generate 500 points – colour the points according to some population indicator, and then distribute them randomly across that area. As you’re mapping the entire population using all available categories, instead of only the value of one category, the technique gives you a good sense of population diversity as well as density within that area. There are flaws, of course, it is a bit more artistic than functionally informative, and the random distribution of categorised points within an area doesn’t always make sense, but at small region sizes it generally works well.

And the technical method – Using open source software, QGIS provides a handy Random Points tool, generating random points within a polygon for any values you give it. The rest of the design was carried out in QGIS. Parks, commercial and industrial zones have been removed prior to the creation of points.

The Maps

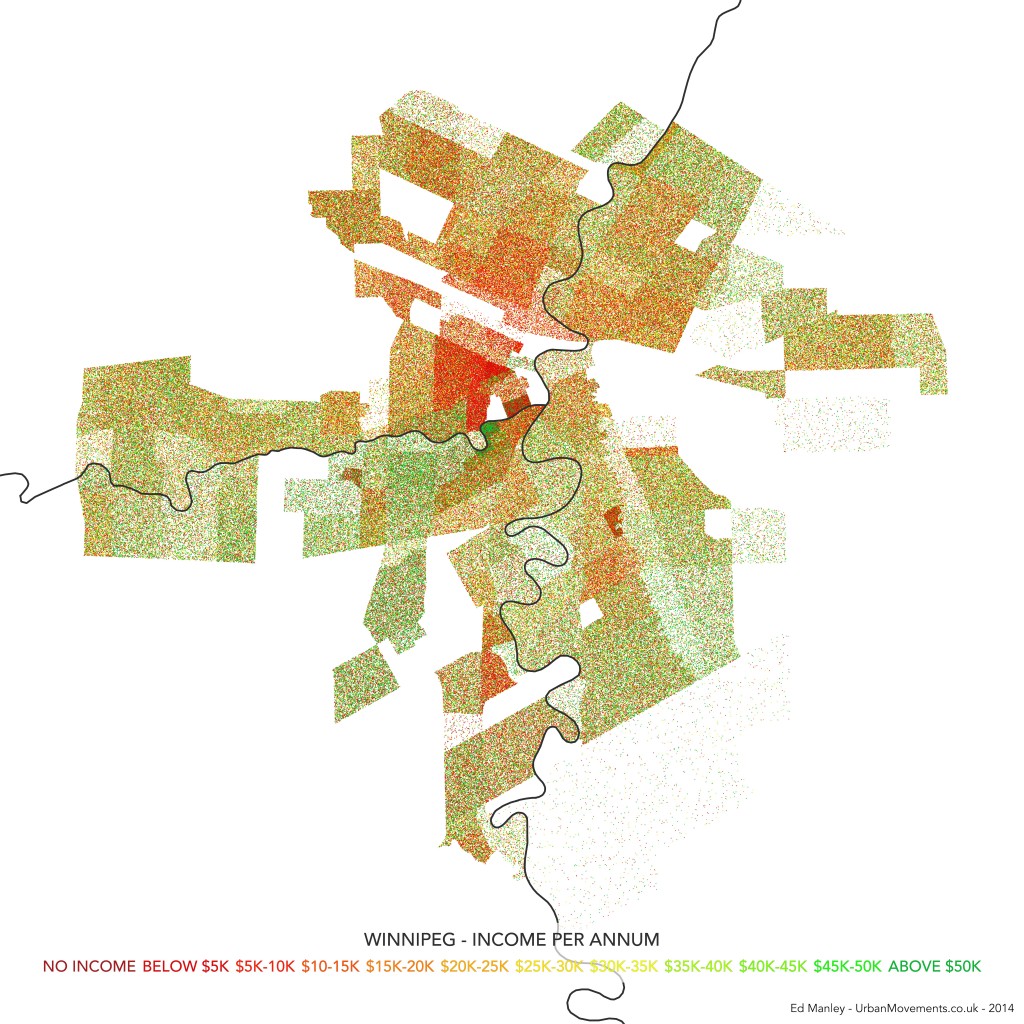
Using these approaches I decided to make three maps – one showing variation in ethnicity, one showing linguistic variation, and another showing income disparity. Each map hopefully complements each other, providing additional context through shared spatial variation.

In each case, a point is drawn representing an individual Winnipegger assigned to a category across each subject area, as reported through Census statistics. Remember, points are only drawn in the areas where people live, so Winnipeg does end up looking a bit skinny compared to how you would see it with commercial and industrial areas added in.

The maps are designed intentionally minimalist (yes, there’s no north bar, no scale), drawing attention to only the features we are focusing on. Only the river is left as a guide, because it is a defining feature of the city, and a dividing line in many cases.

Without further ado, here are the maps. You can click on each on for a fully zoomable version.
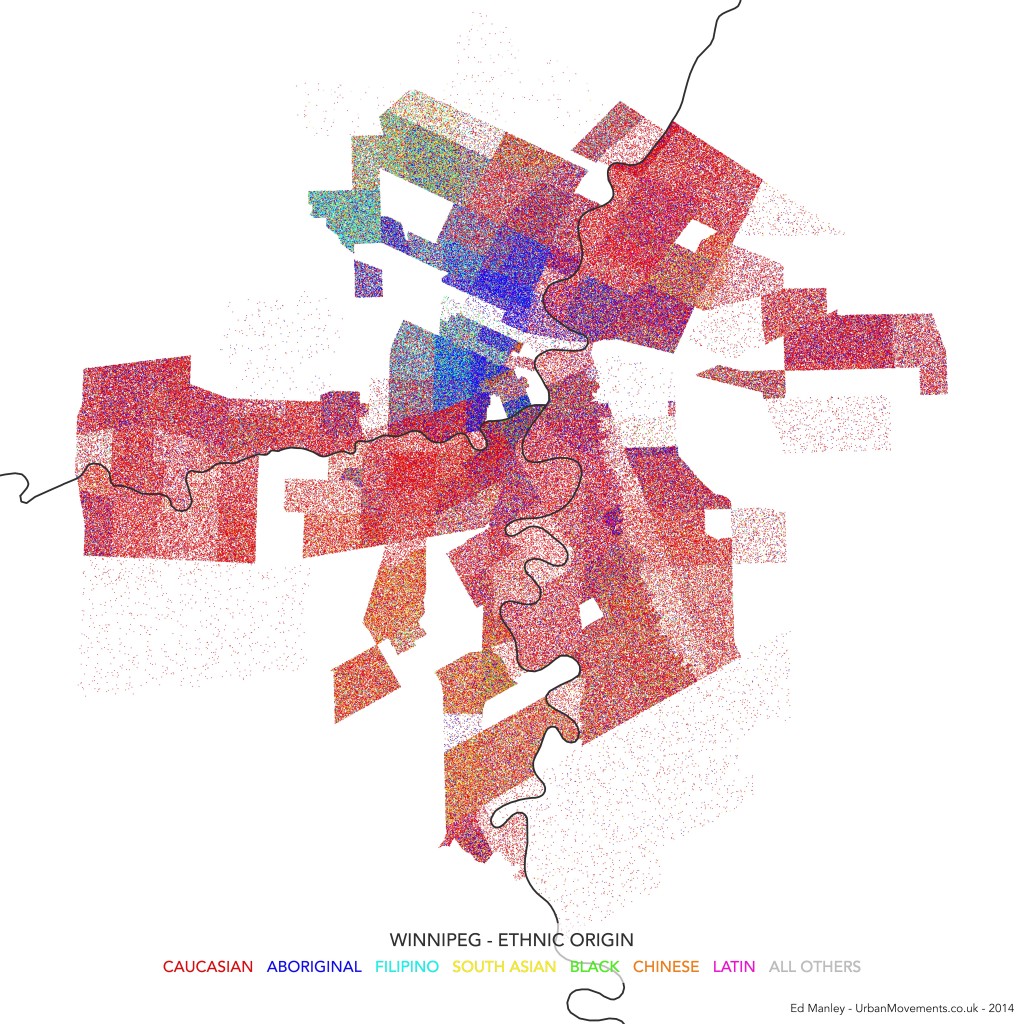
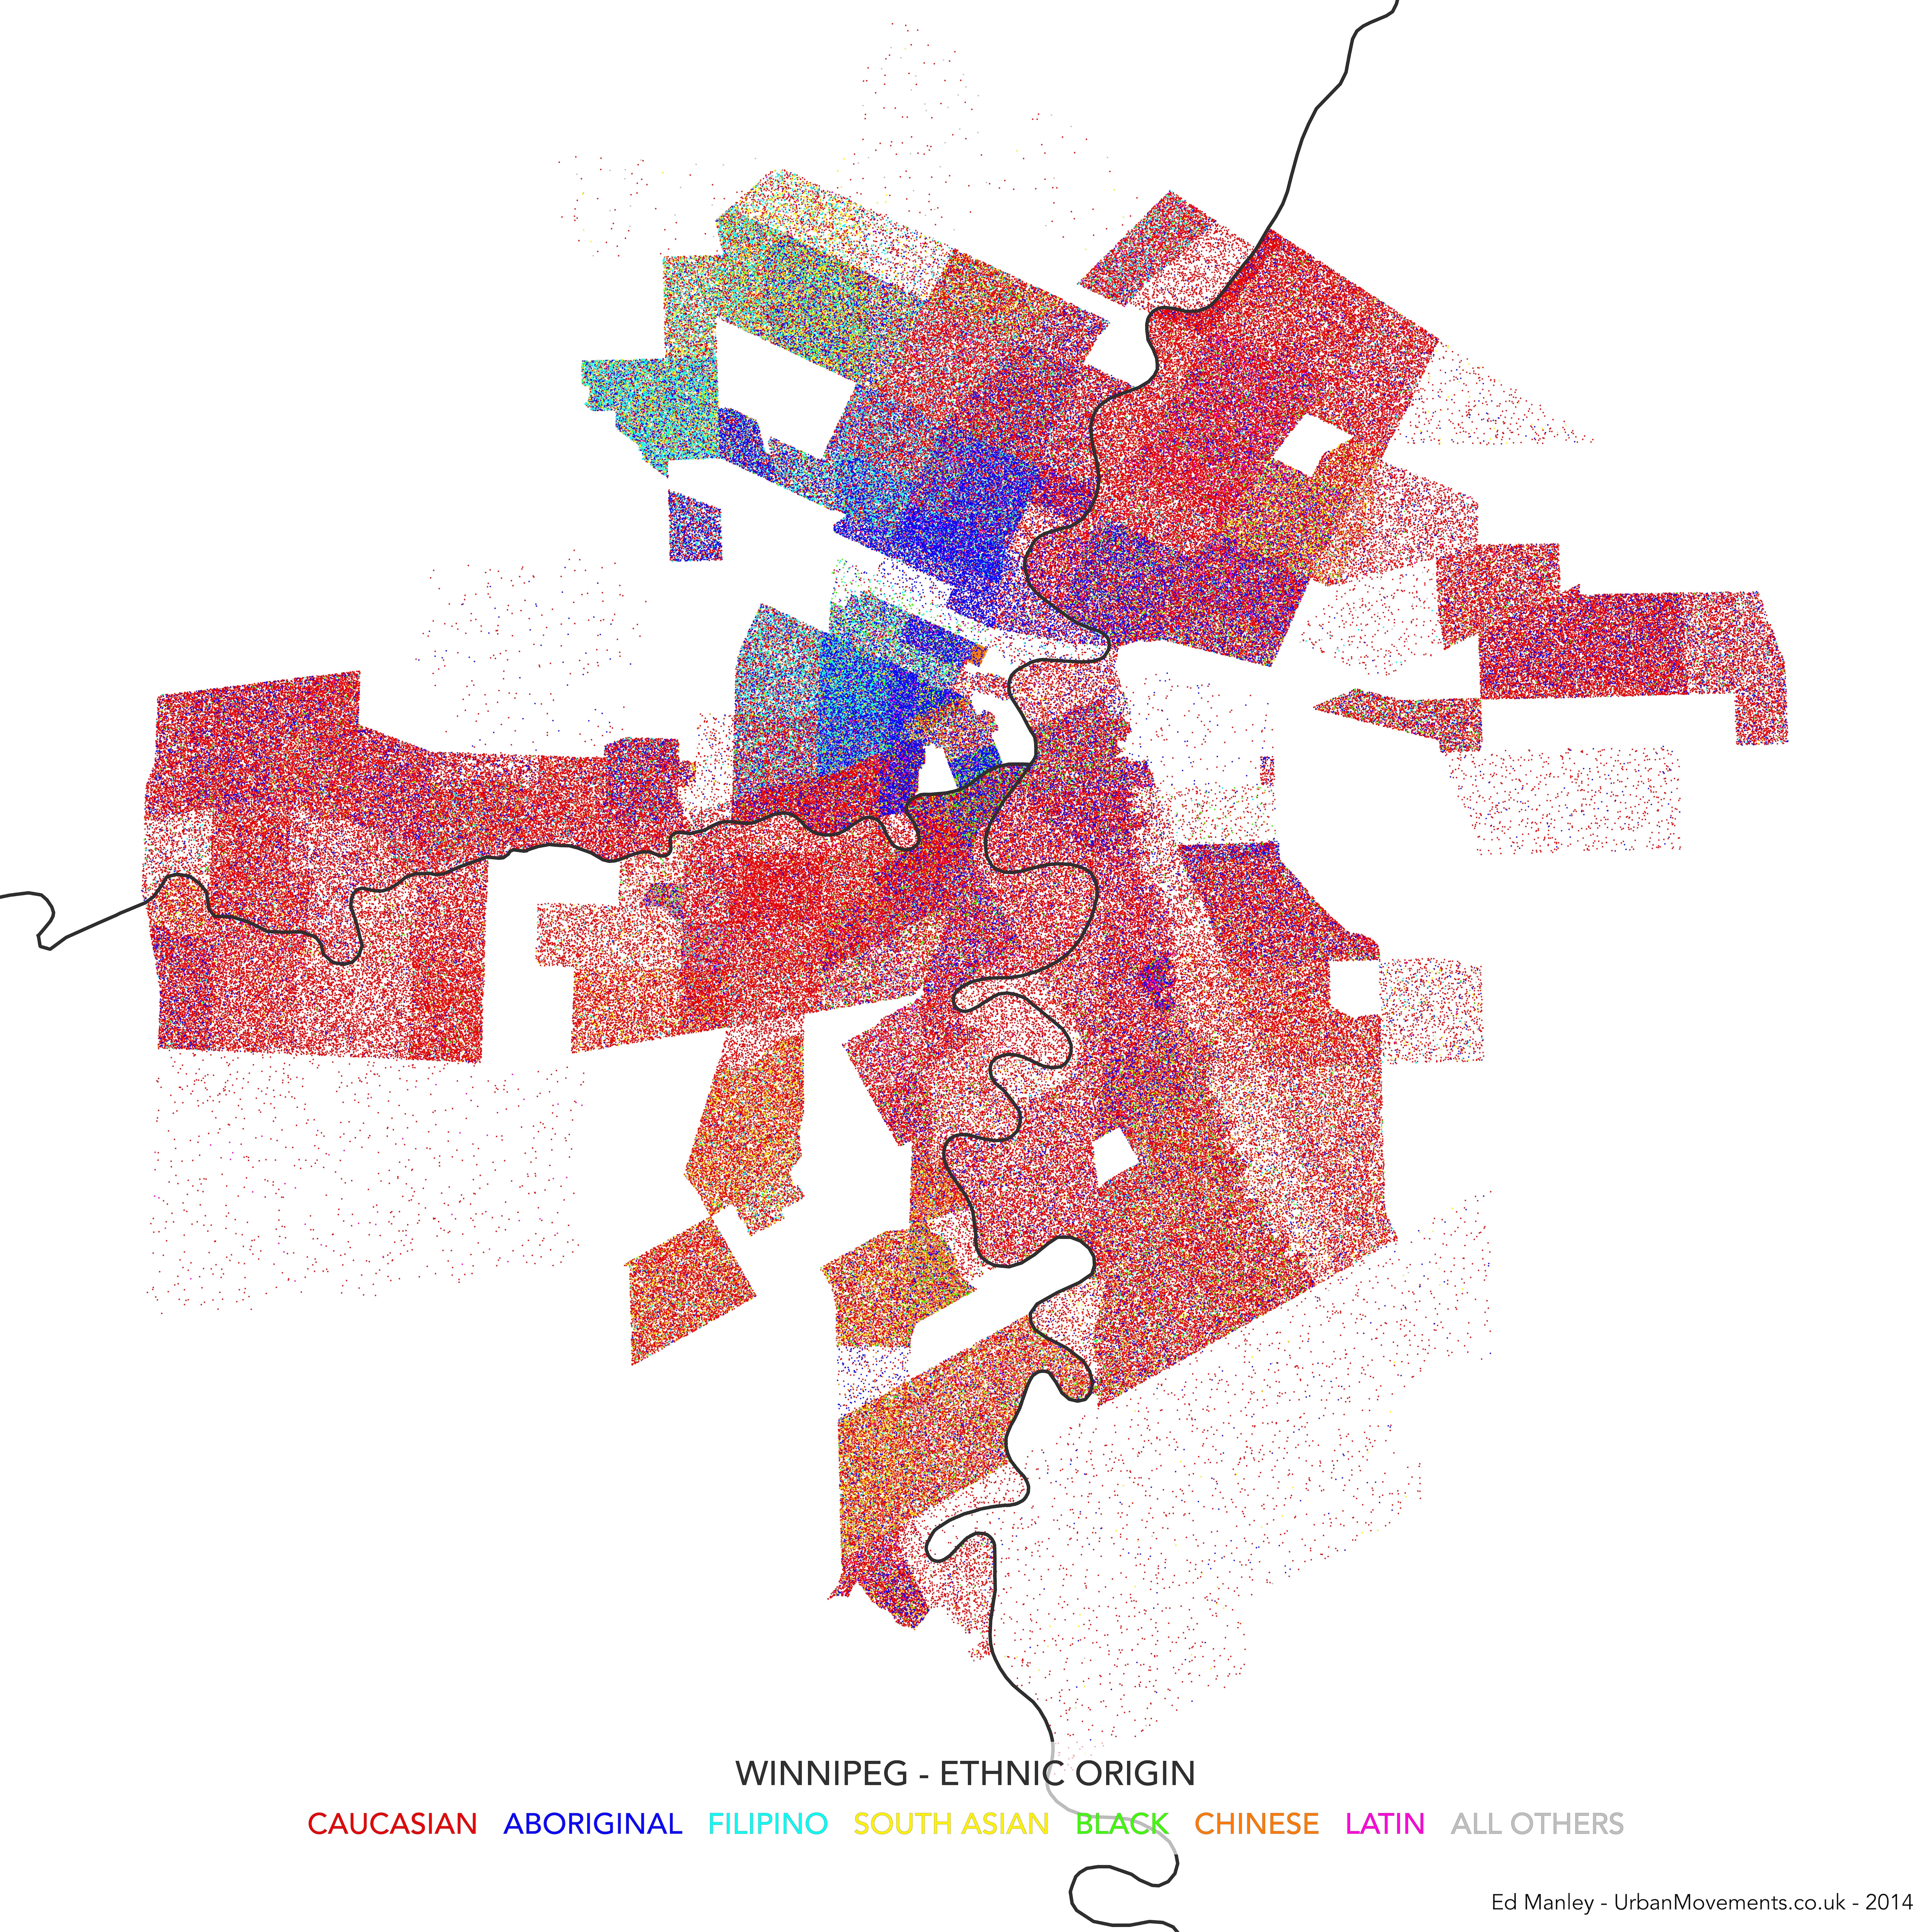
Dot Density Map of Ethnicity in Winnipeg, Canada
Dot Density Map of Language Knowledge in Winnipeg, Canada
Dot Density Map of Income Variation in Winnipeg, Canada


The maps each show how demographic characteristics vary across city neighbourhoods. But I think together further value is added, as they hint at another story of association in characteristics, where trends correlate in areas of the city.

It is not really for me, as a non-Winnipegger to pass any judgement on whether these maps ring true with the lived Winnipeg experience. From my visits to the city, these align with what I’ve seen at least. It would be interesting to hear how Winnipeggers do relate to these maps.

 

Mapping Multiculturalism: ONS and the Sensitive Issue of Map Design

In case you hadn’t noticed, the ONS released their latest tranche of Census 2011 results today.  The data has received considerable fanfare in the media already, looking set to dominate political debate over the coming days.  One big story that appears to be arising from today’s release features the hot political potato of multiculturalism.

Before I start I’d like to emphasise that this blog post isn’t intended to comment on these results in any way, merely to point out clear examples of how, through the design of their the ONS have implicity directed the interpretation of these results.  In fact, it perhaps raises once again the important issue on how data and visualisation can be used to influence how results are perceived by the viewer.

ONS Interactive and Colour Selection

Along with this latest release, the ONS provided an interactive tool to enable the exploration of the results by category and in comparison to 2001 results, and these maps have been featured widely in the media coverage thus far.

Now, most people who have ever designed a map know that colour selection is vitally important.  The categories and colour scales you pick help to determine how a map is viewed and the message that is taken away.  I won’t go into detail here but more information and a nice tool for testing these principles out is available here. In effect, you build up a strategy for the presentation of your data.

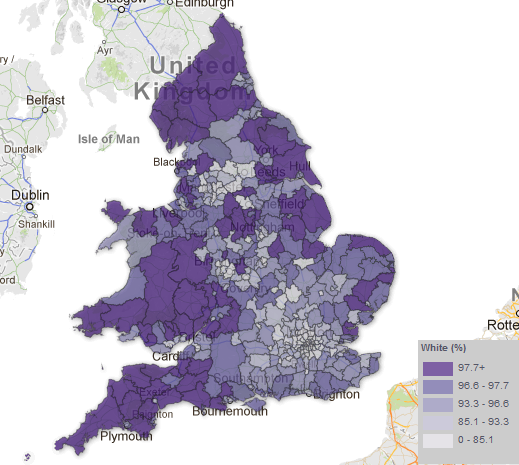
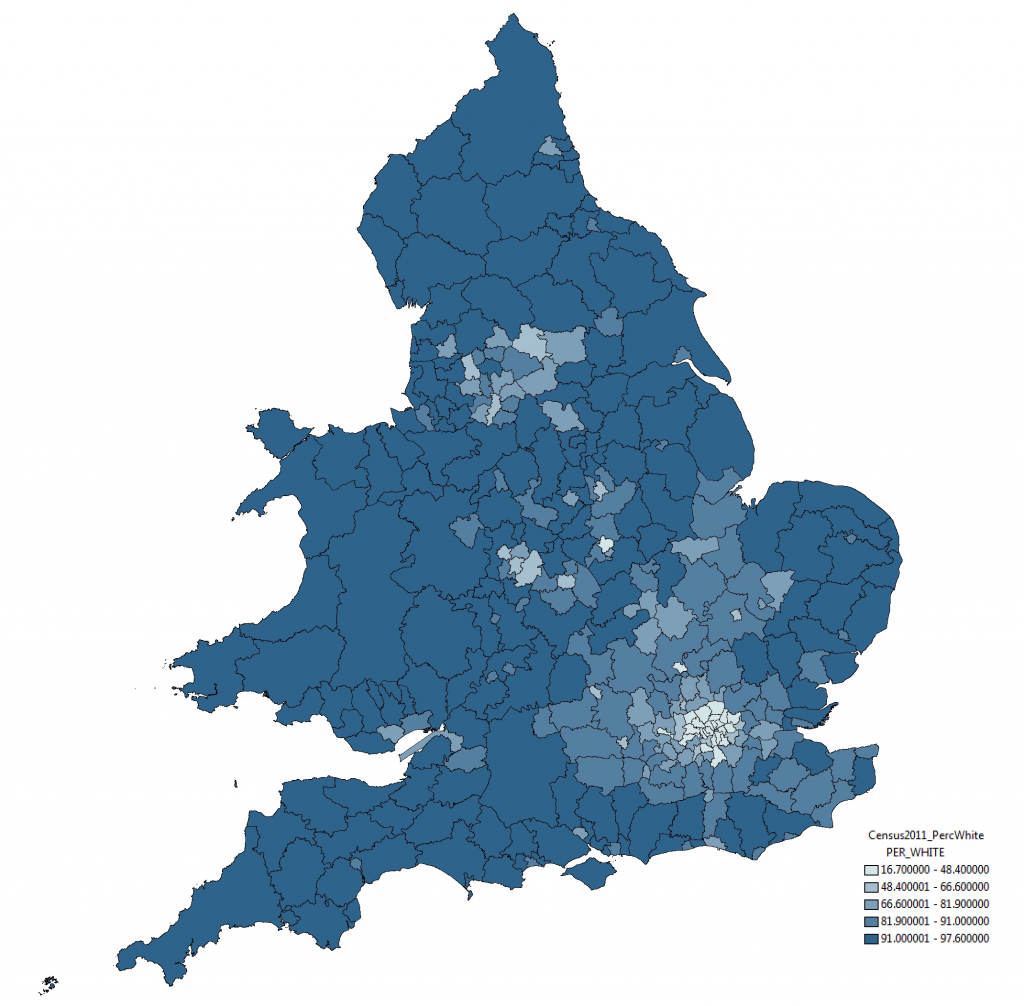
With respect to this issue, the strategy taken by the ONS in this instance is somewhat peticular.  Take a look below at the ‘Percentage White’ ethnicity map by Unitary Authority, taken from the ONS website:

Mapping Multiculturalism: ONS and the Sensitive Issue of Map Design

The rather strange selection of categories – whereby variation around 12 percentage points (between 85% and 97%) is split into three categories and variation around 85 percentage points placed into one category – mean that relatively small differences in the value of this attribute are represented as considerably different through the colouration of the map.  This, to me, seems like a very strange approach.

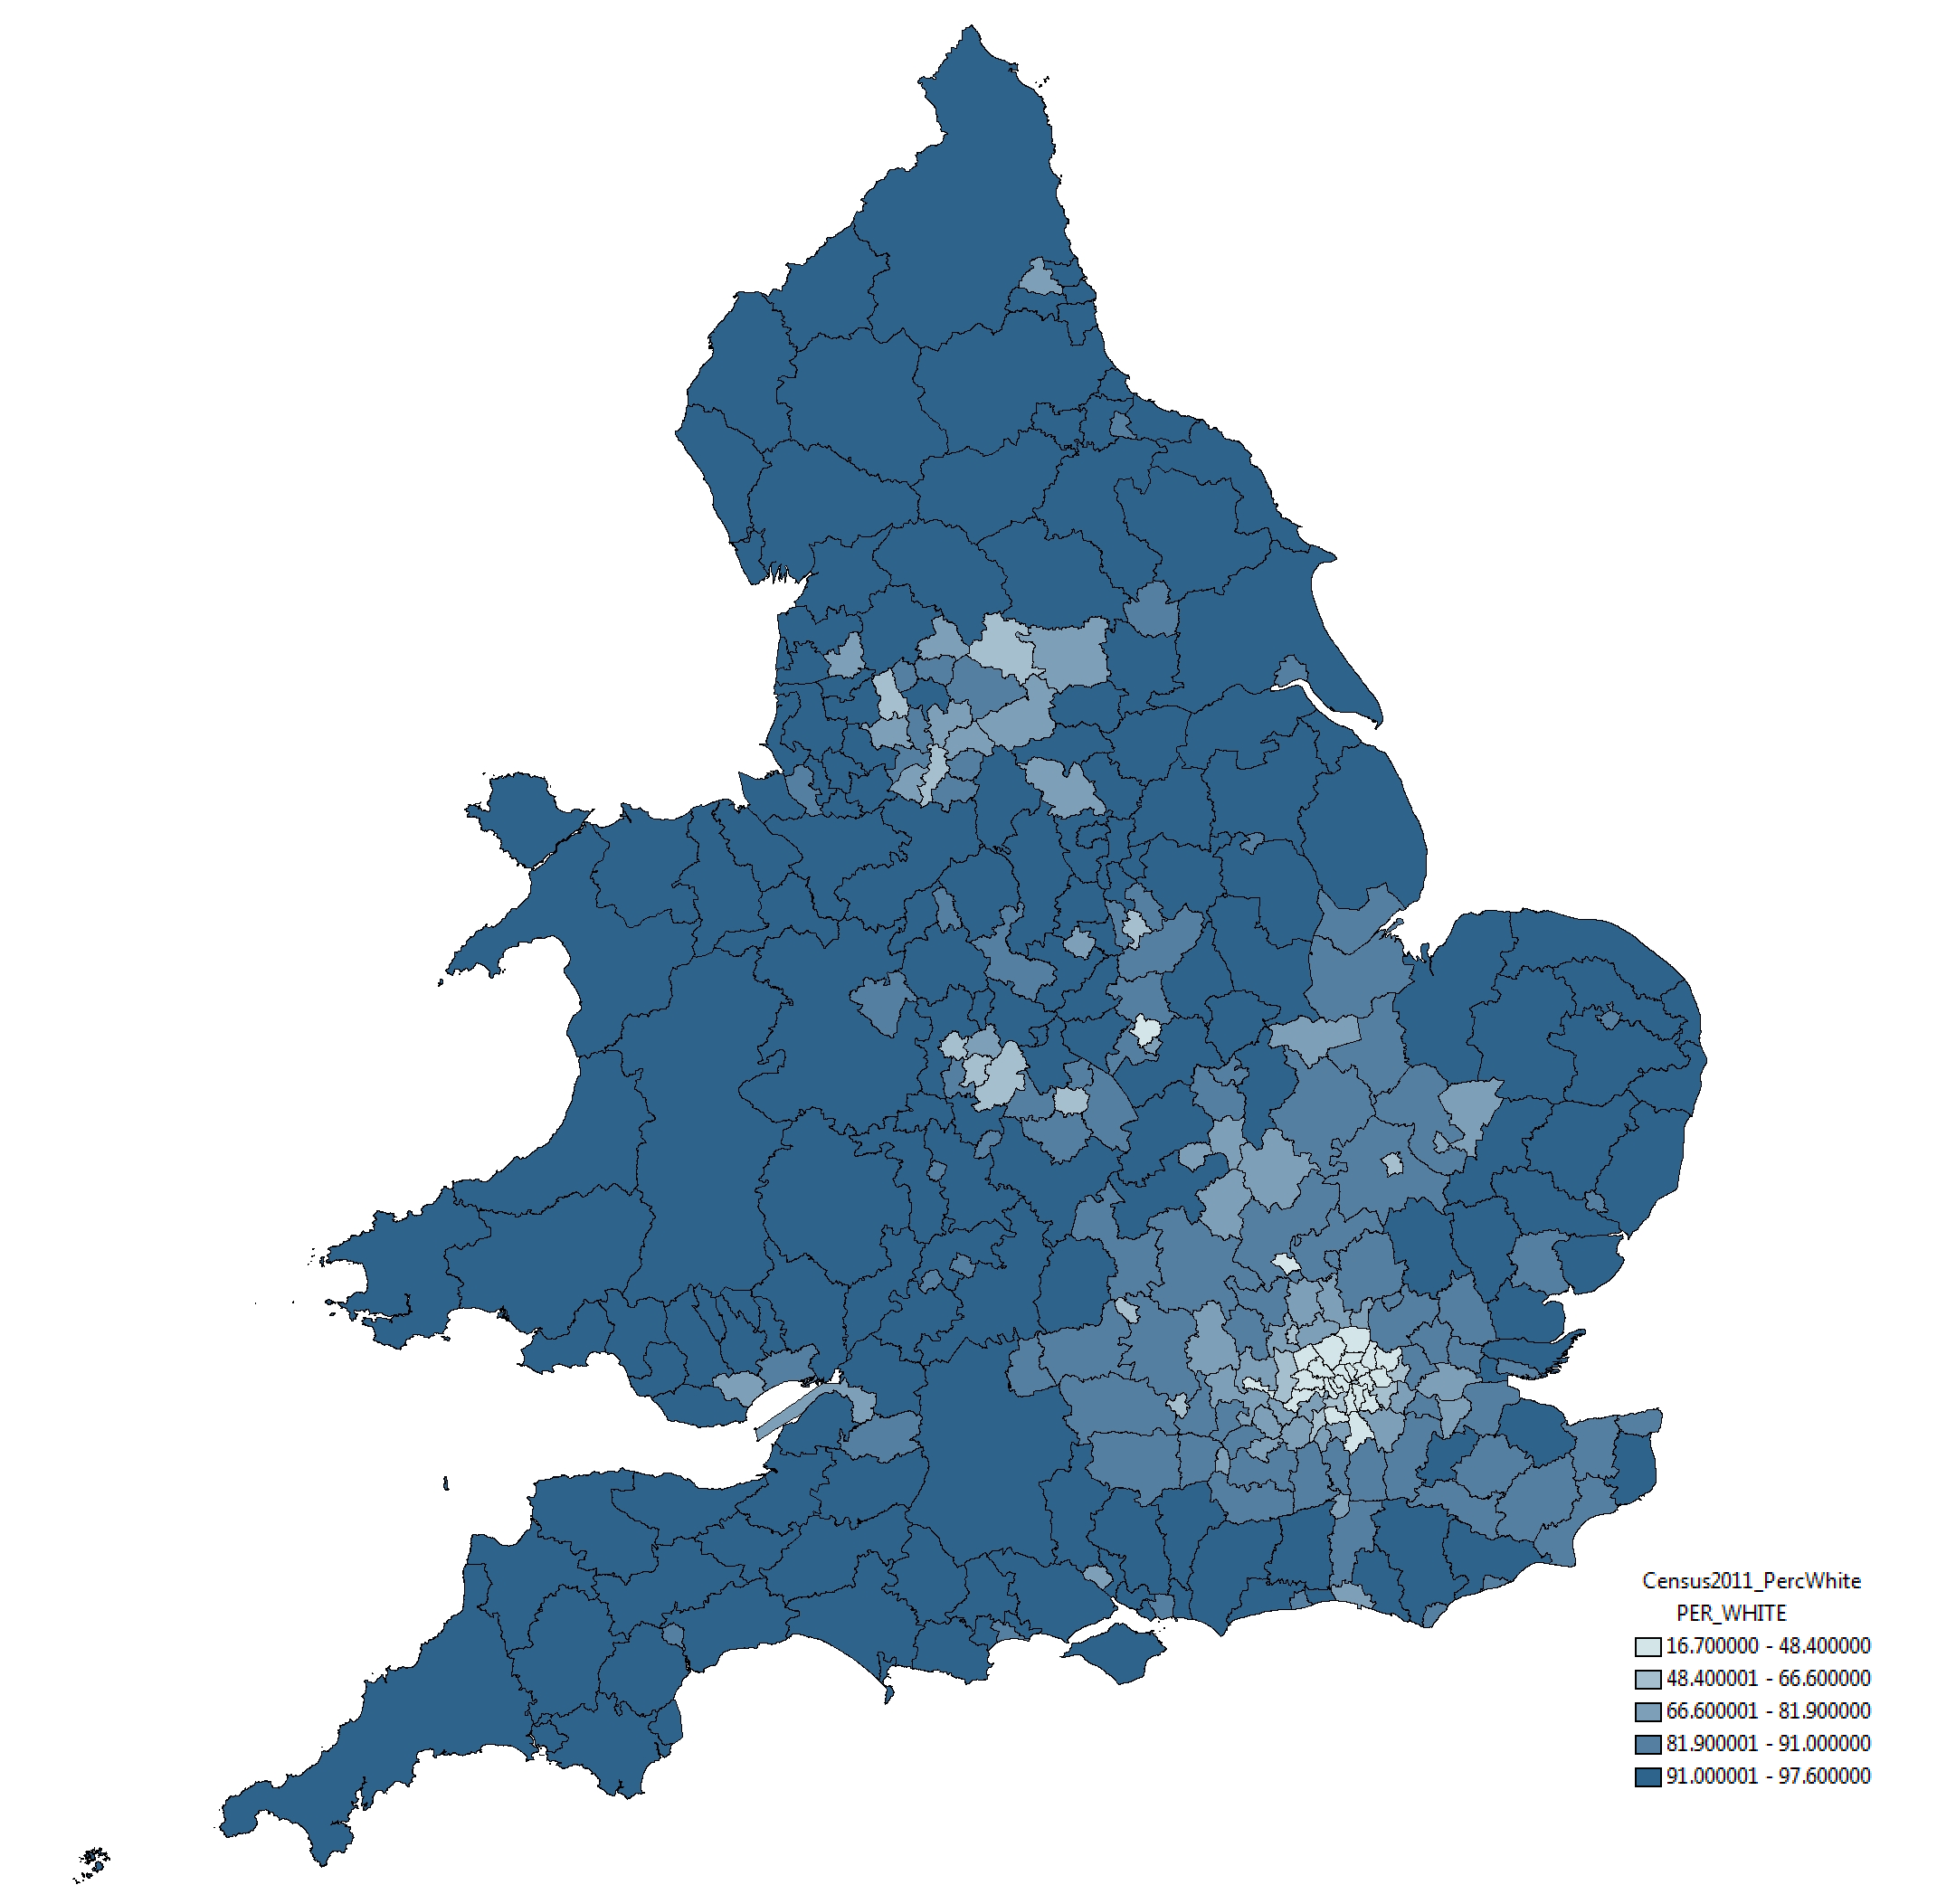
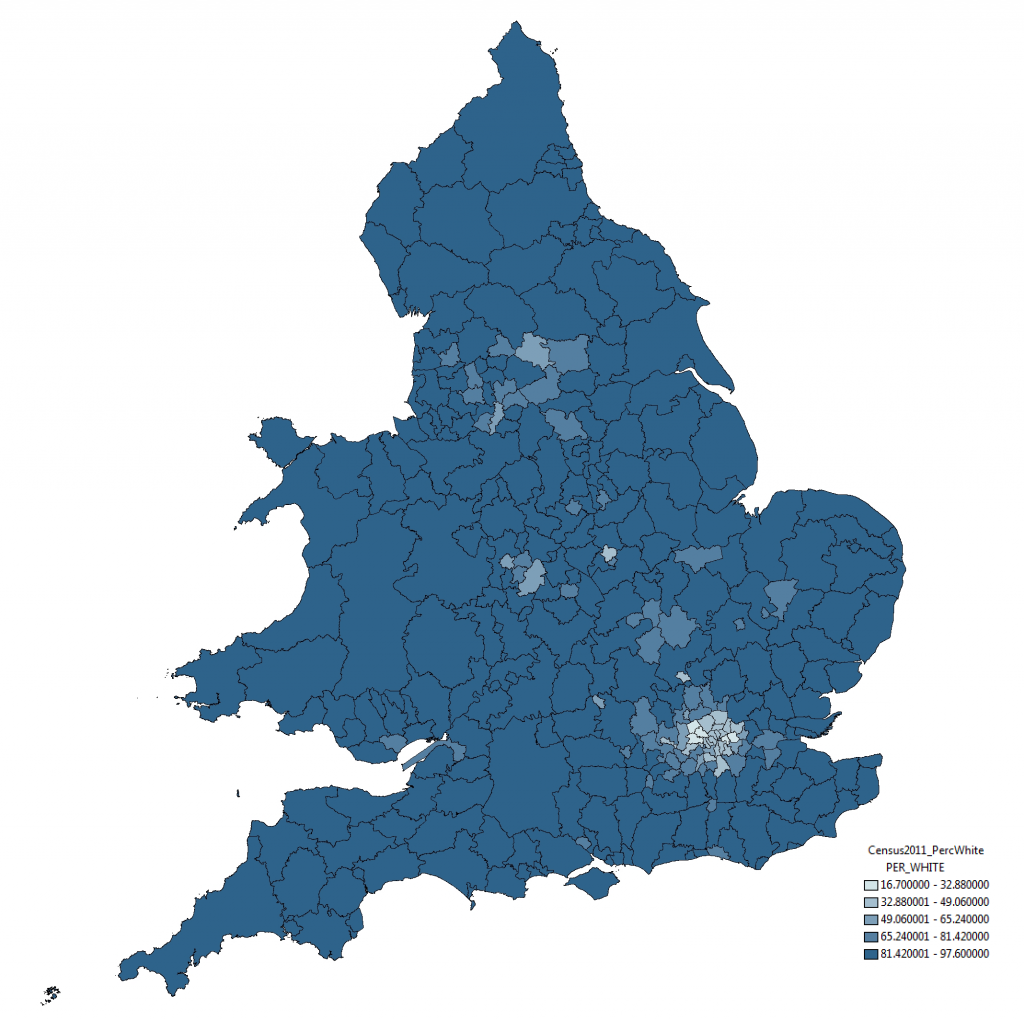
To indicate this point more clearly, take a look at the map below of exactly the same data and same geographical boundaries.  All we have done here is use a standard symbology method, the Jenks Natural Break Optimisation method.  The results are quite different:

Mapping Multiculturalism: ONS and the Sensitive Issue of Map Design

In this map, through the categories selected using the Jenks algorithm, small variations between districts are absorbed and a truer sense of the variation is presented.  Similar results are found using other standard symbology approaches; some, such as Equal Interval categorisation shown below, indicate even lesser variation among the data:

Mapping Multiculturalism: ONS and the Sensitive Issue of Map Design

As I say, these are just standard methods and implemented in mainstream GIS software, nothing special and what would ordinarily be used in representation of such data.  For some reason the ONS have chosen to take an alternative direction.  And ‘Ethnicity’ isn’t by any means the only case of this, the same approach is employed in mapping ‘Born in the UK’ and ‘No Qualification’ data also.

Making Maps to Make your Point

I think what this demonstrates is a timely lesson in how maps can be used to influence how a viewer receives information.  Very few of the people looking at the ONS maps today will consult the map key before making their mind up about the results.  As a result, I feel, these people make take away an inaccurate understanding of what the underlying data actually represents.

I’m not sure what has lead the ONS to make the choices they have made with respect to their map design*.  They may well have a reason for selecting their colour categories in this way, but in emphasising small variations in data such as these they only go to helping to whip by political frenzy.


Update on 12-12-2012

* As you can read below, Robert Fry from the ONS got in touch about this issue.  It would appear that the motivation behind the map design is not as considered as I may have first suggested.  I have amended the blog post accordingly, although feel this still episode still provides an important lesson.