
By way of a warm up to future blogging pleasures, I thought I’d post some mapping work I did for actual fun last year. As Christmas gifts for family I decided to make some custom maps of Winnipeg, Canada (location not chosen randomly, they’re actually from there).
Don’t know Winnipeg? Well… It’s a city of nearly 700000 in the middle of North America, it has a big ice hockey team, and it gets blooooooddy cold in the Winter. My extensive research also seemed to suggest that Winnipeg doesn’t get its fair share of nice city maps – that needs to change.
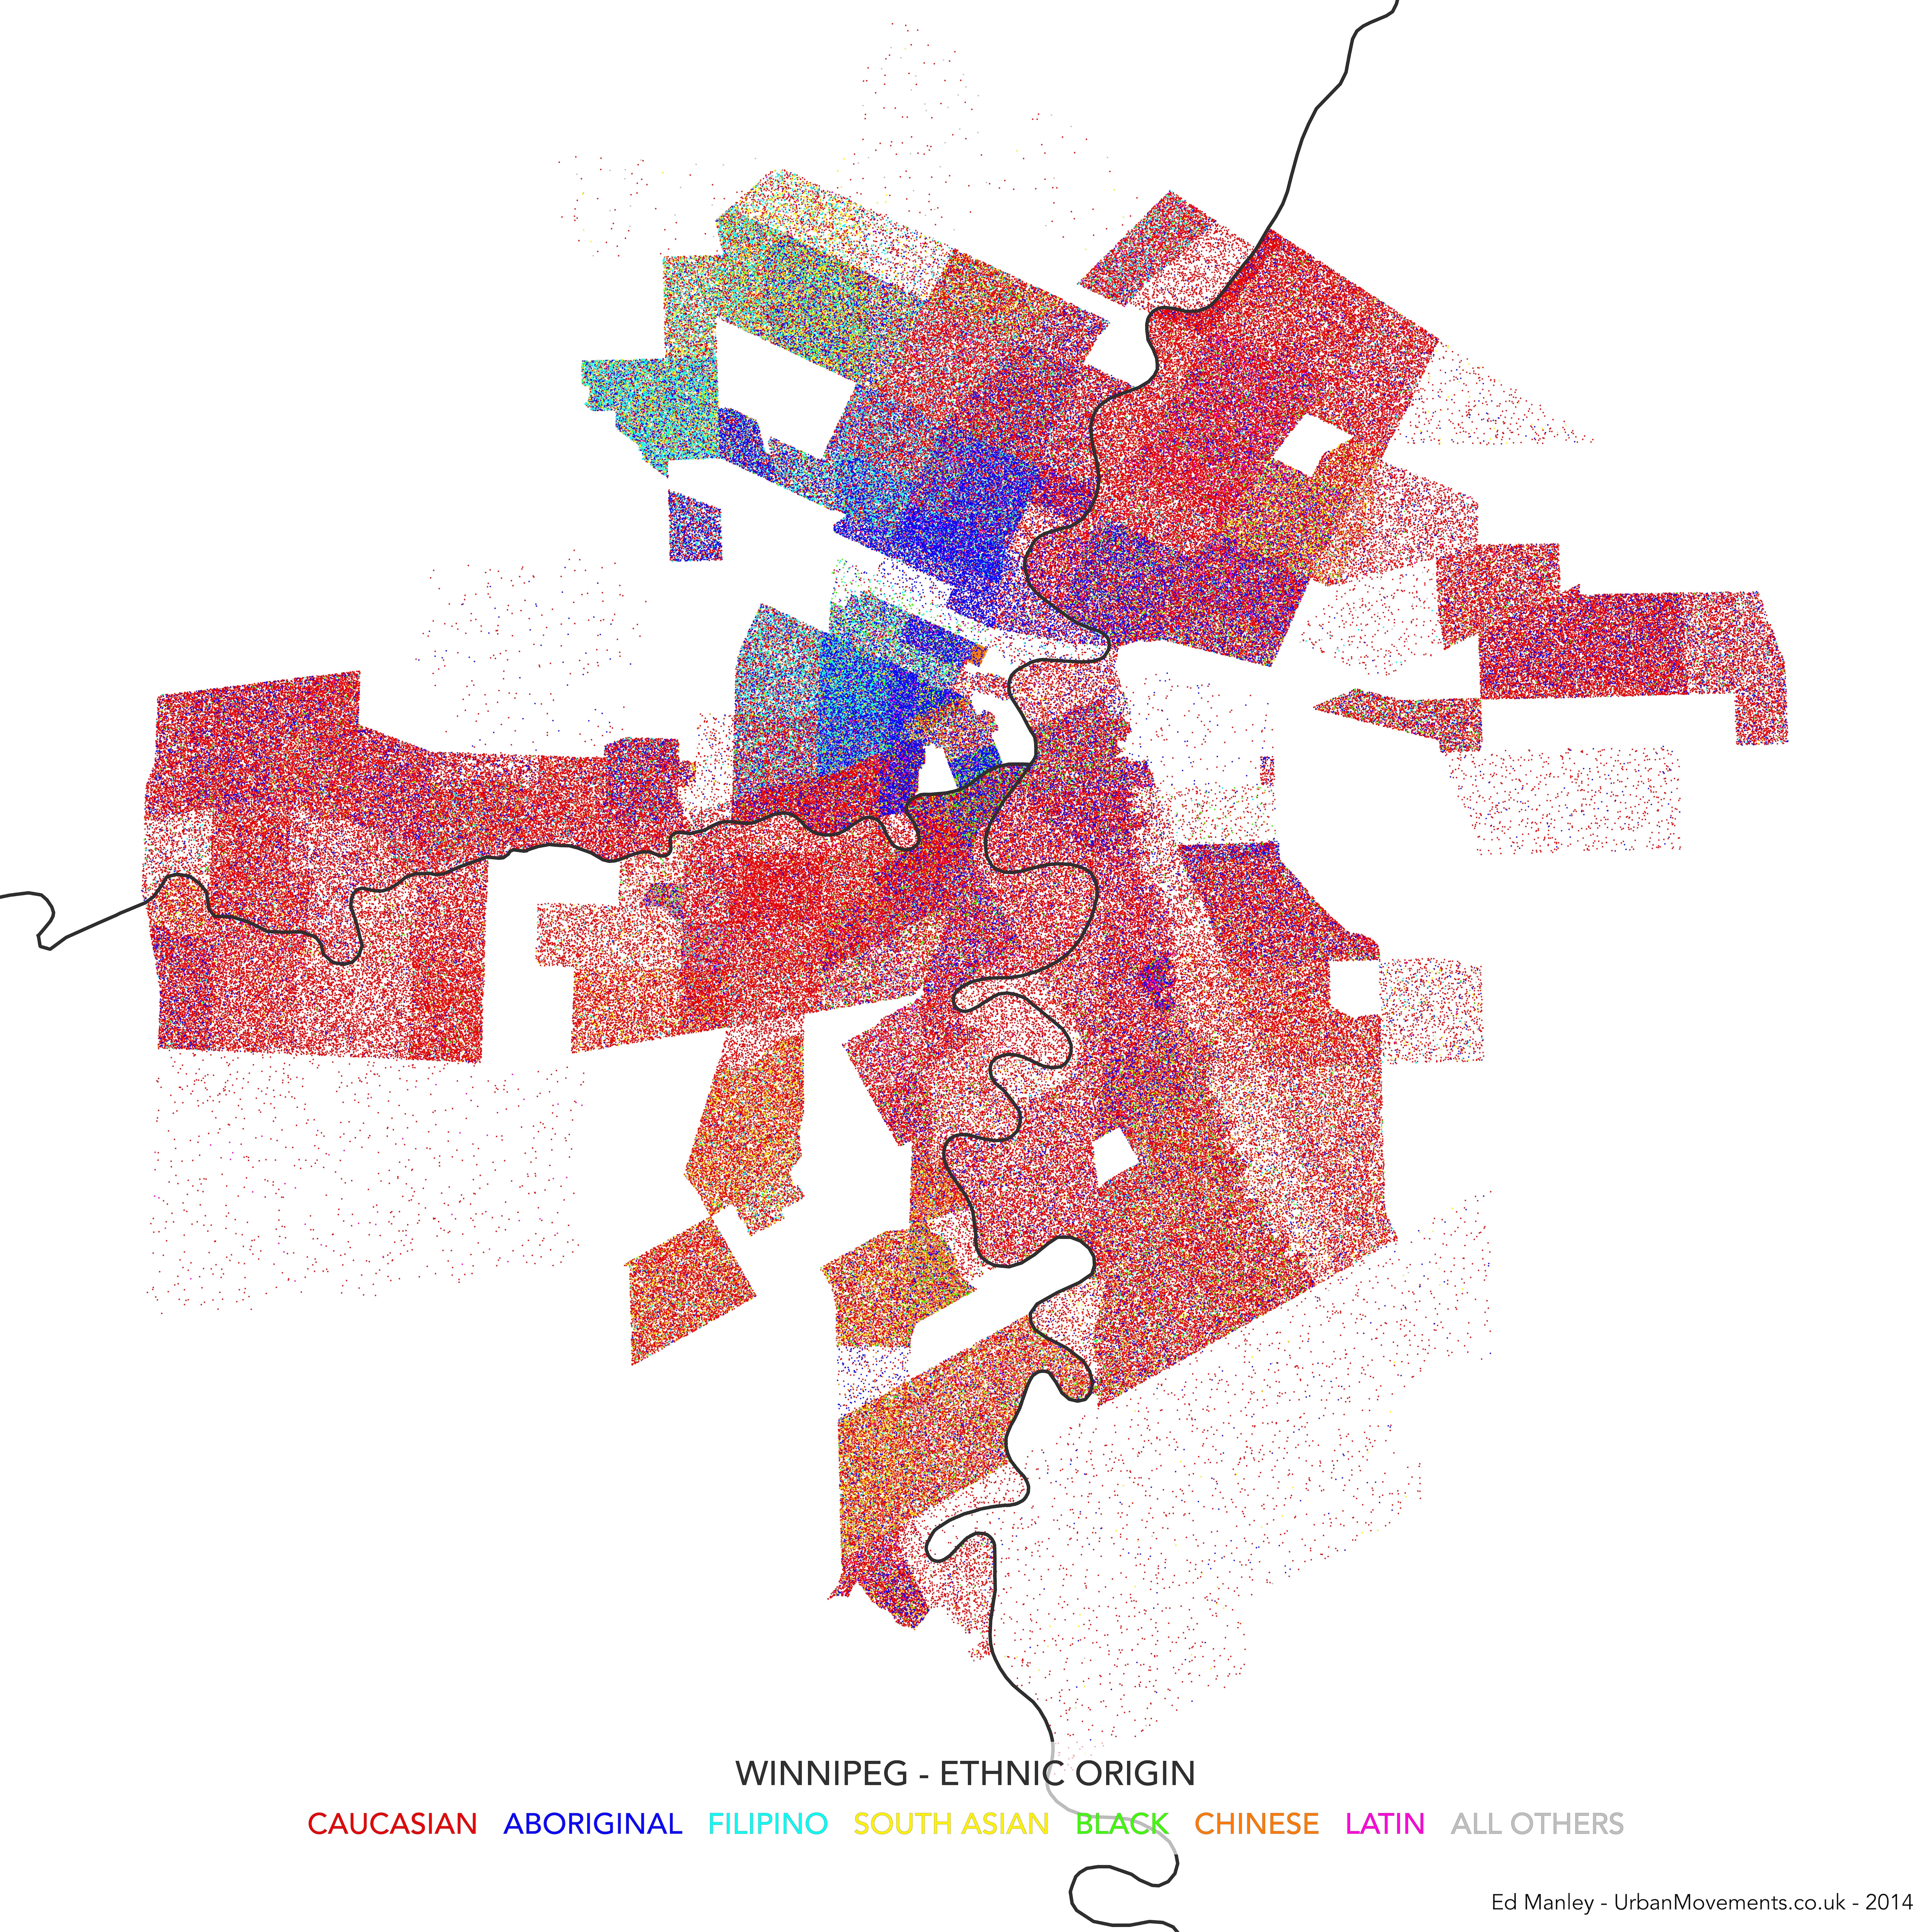
Like many North American cities, walking around Winnipeg you get a sense of how the city starkly changes from neighbourhood to neighbourhood. Winnipeg contains the largest urban population of Native Canadians in Canada, with the community strongly concentrated near to Downtown and northern suburbs. There is a historic French speaking region too, named St Boniface, and a small Chinatown, both near to central Winnipeg. Capturing this diversity (and division) was one of my aims from the start.
Open Data and Open Mapping
It turns out that Winnipeg has a decent supply of Open City Data. It has an Open Data portal – data.winnipeg.ca – based on the useful Socrata platform, as well as a live transit data API. Looking through the available datasets, although it was pretty tempting to make a map of ‘sewer backups’ (nice) or reports of graffiti, someone had done a pretty good job of organising neighbourhood-level 2006 Census data. These datasets were well organised and appeared to provide rich information relating to local demographic variation.
In terms of the map format, my first instinct was to turn to dot density mapping. Dot density maps use multiple points to indicate the categorisation and density of features (e.g. some things) within a region. These maps are often used to map Census statistics, where single points equate to actual individuals. For each Census area, you generate points for the population in the area – you have 500 people, you generate 500 points – colour the points according to some population indicator, and then distribute them randomly across that area. As you’re mapping the entire population using all available categories, instead of only the value of one category, the technique gives you a good sense of population diversity as well as density within that area. There are flaws, of course, it is a bit more artistic than functionally informative, and the random distribution of categorised points within an area doesn’t always make sense, but at small region sizes it generally works well.
And the technical method – Using open source software, QGIS provides a handy Random Points tool, generating random points within a polygon for any values you give it. The rest of the design was carried out in QGIS. Parks, commercial and industrial zones have been removed prior to the creation of points.
The Maps
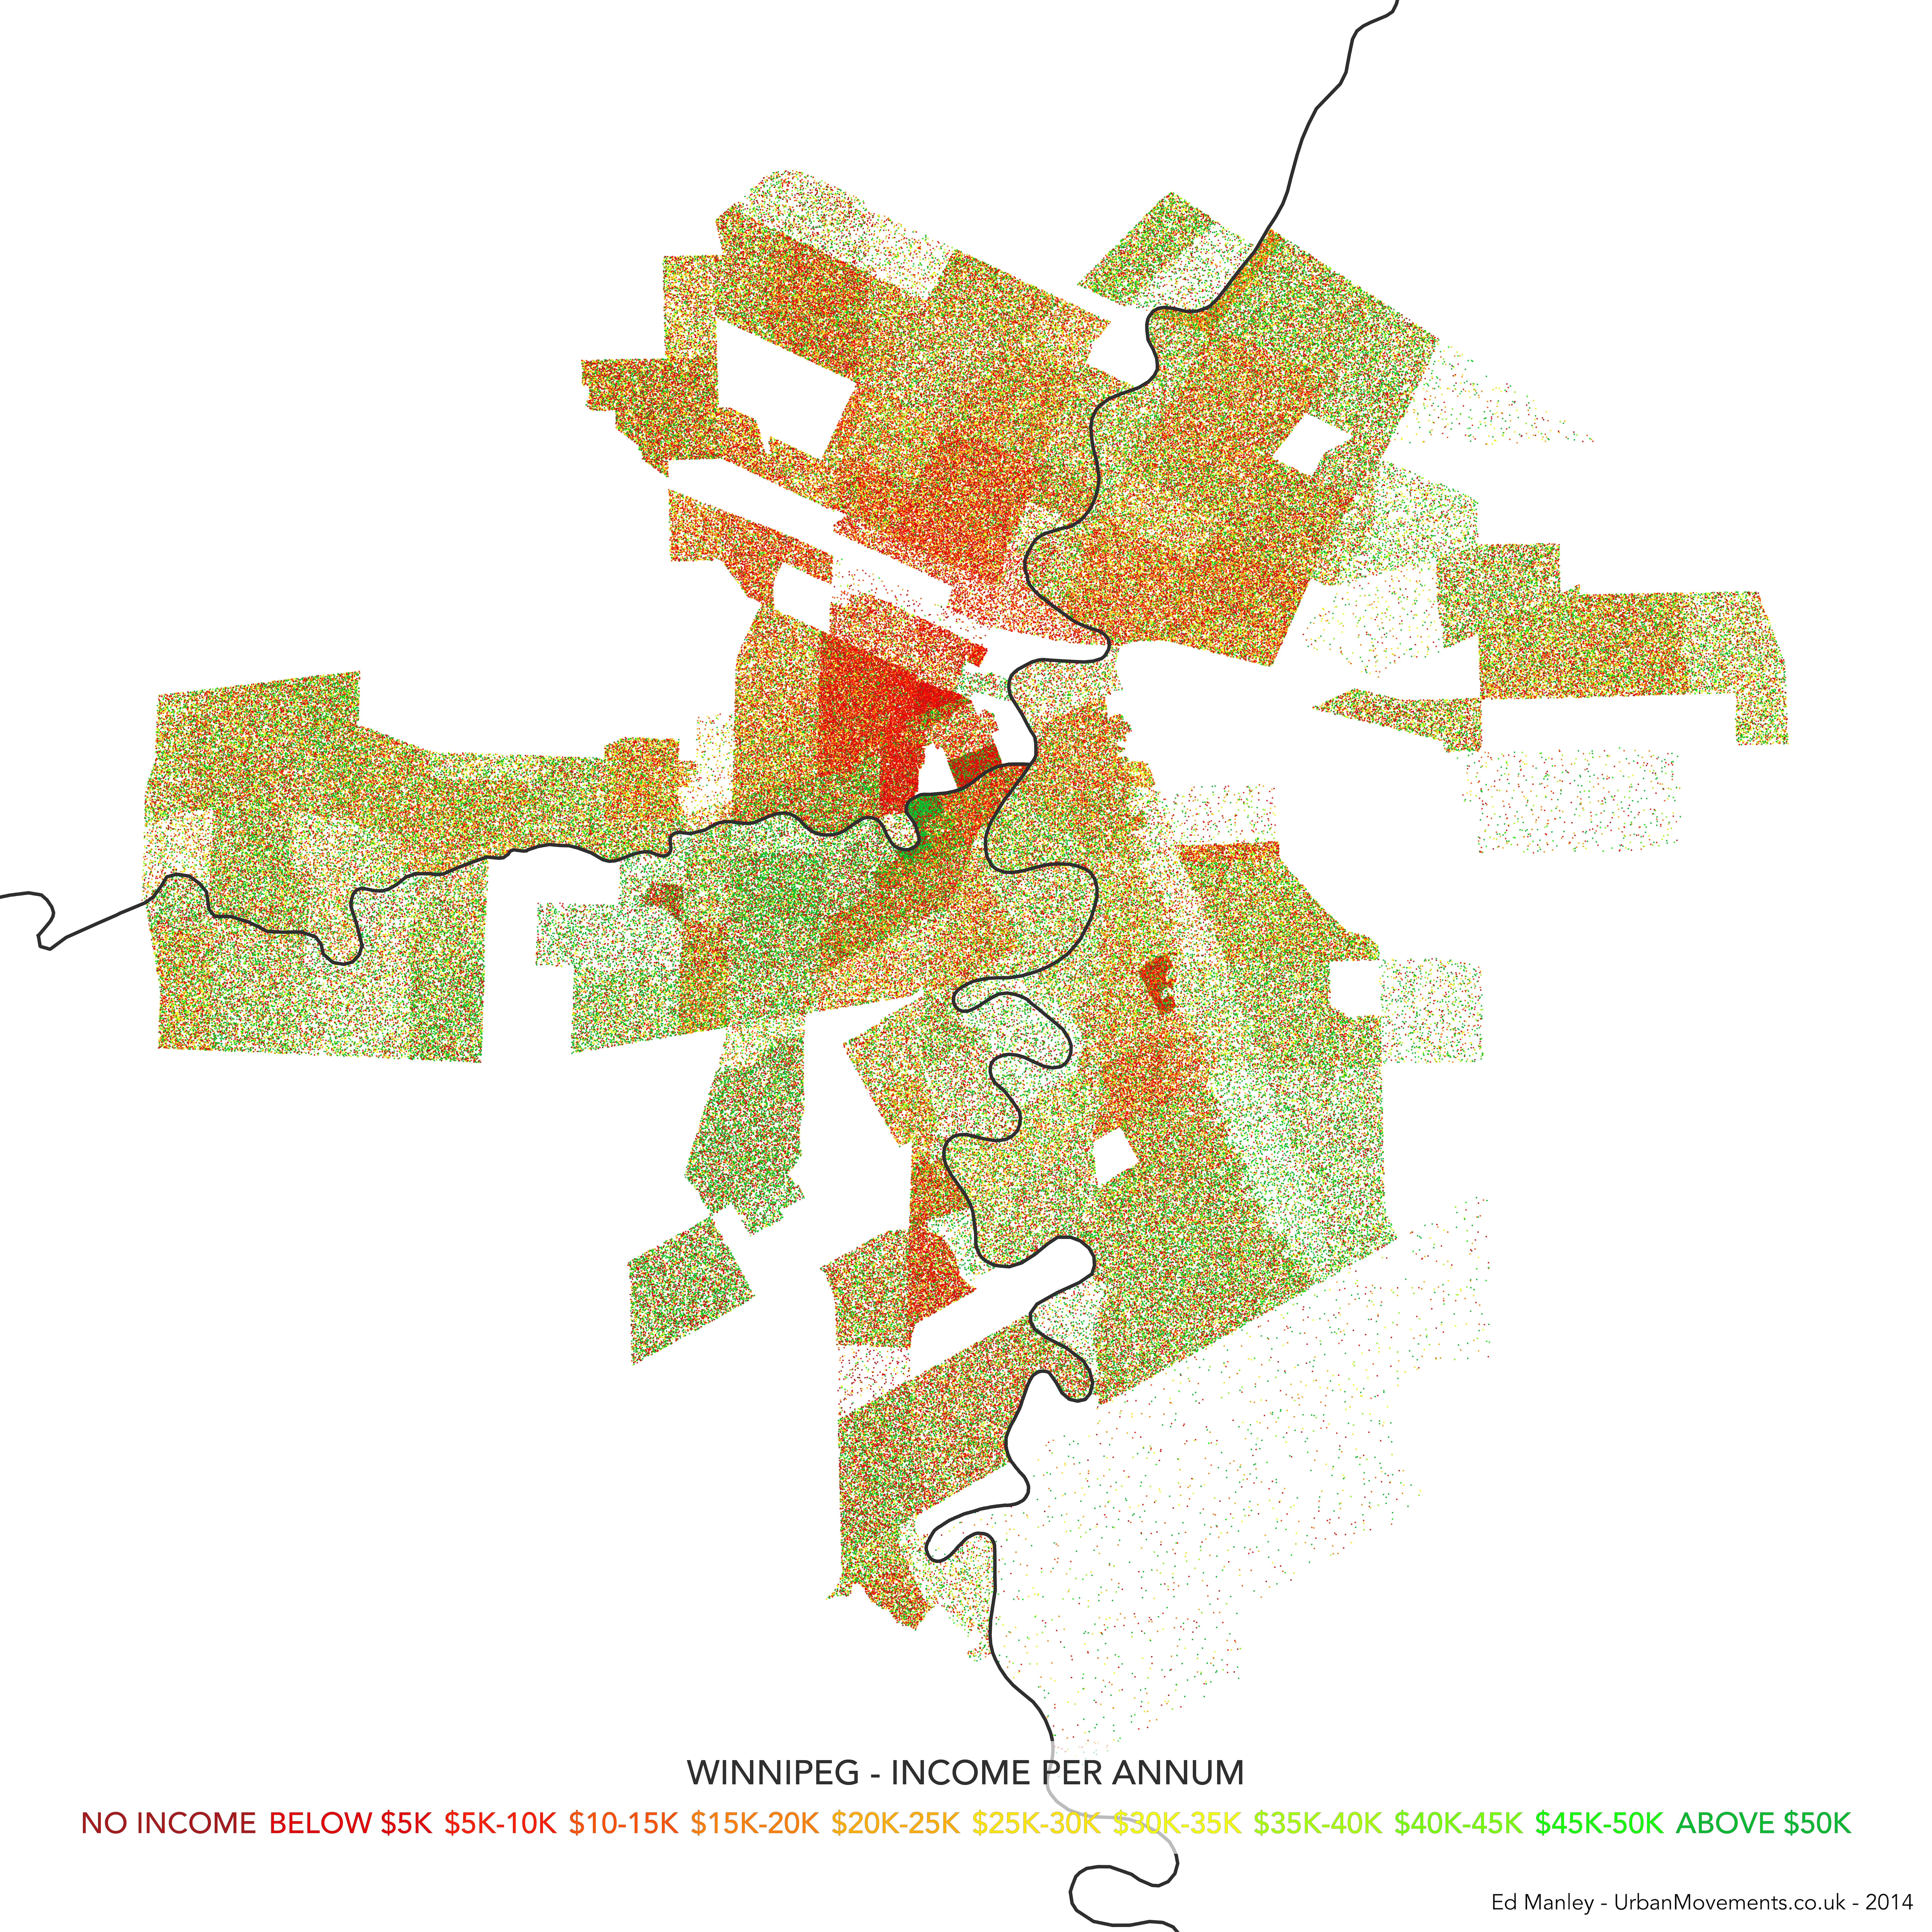
Using these approaches I decided to make three maps – one showing variation in ethnicity, one showing linguistic variation, and another showing income disparity. Each map hopefully complements each other, providing additional context through shared spatial variation.
In each case, a point is drawn representing an individual Winnipegger assigned to a category across each subject area, as reported through Census statistics. Remember, points are only drawn in the areas where people live, so Winnipeg does end up looking a bit skinny compared to how you would see it with commercial and industrial areas added in.
The maps are designed intentionally minimalist (yes, there’s no north bar, no scale), drawing attention to only the features we are focusing on. Only the river is left as a guide, because it is a defining feature of the city, and a dividing line in many cases.
Without further ado, here are the maps. You can click on each on for a fully zoomable version.

The maps each show how demographic characteristics vary across city neighbourhoods. But I think together further value is added, as they hint at another story of association in characteristics, where trends correlate in areas of the city.
It is not really for me, as a non-Winnipegger to pass any judgement on whether these maps ring true with the lived Winnipeg experience. From my visits to the city, these align with what I’ve seen at least. It would be interesting to hear how Winnipeggers do relate to these maps.
Interesting look! Thanks for doing it. One criticism : where’s the baseline? Why not show a map with black dots, one for each person? Give some context. More of an issue with heat maps, but I think it’s still a nice support.
The language map is pretty interesting; St. Boniface is our French quarter (shows up well on the map) and it would be interesting to see if the spillover into the downtown comes from them, or is just a highly educated population.
Thanks for the work.
Black dots?!
Now that’s racist!
I love this! Thank you for posting it. Its very complementary to a related community indicators system that we have for Winnipeg, where we use maps as one way of sharing information about our city. Its called Peg and its at http://www.mypeg.ca
50000 is a very low income standard. No wonder there is a ton of green
…but all that red didn’t phase you? For comparison, the median income for individuals in Canada is around $25,000, whereas median household income is around $68,000. So, depending on the census data, 50k is probably a good choice for a nice colourful map!
I like these maps! they make me question things, which i think is a great thing. Like that area where the lowest and highest income intersect parted only by the river.
I’d love to see a one of these showing the population to see if there are any correlations. love it love it love it, keep up the great mapping.
Is age or education possible..those would also be cool to see. Really fun to explore these..thanks!
Income is way off. I’d suggest a range of 10-300k would be telling.
Does anyone have an explanation for that little pocket of Osborne village that is SUPER green? It’s where the river changes direction at the west-end of Roslyn. https://www.google.ca/maps/@49.8796104,-97.1513805,17z?hl=en
Lived there for years, nice little pocket. Rather unique in Winnipeg because it consists of both low-density single-family houses interspersed with several high-rise towers. Single-family homes tend to be occupied by retirees with a tidy nest-egg. Tower dwellers tend to be working-age and relatively well earning sorts. Very few children in the vicinity. i.e. single or double high income earners with no kids. The area is sought after because it is near but ‘not-too-near’ to the diversity of Osborne Village, near to downtown (i.e. quite a few people walk to work, which is rather unique for Winnipeg).
Ziggy, that is also at the start of Wellington Crescent and where ther is a large number of expensive condos, namley #1 Wellington Cres, where each floor ismits own unit and probably starts at $500000
Each floor starts at 1 million!
Fascinating! While many Winnipegers have a general idea of these “borders”, do most understand what this means for city development and planning? Plus these are fun to look at with one’s own pre-conceptions!
i am not surprised at the origin of this doc. Only a Brit would still refer to Africans as black people in this age and time. Simply a thing of the mind!
The Black category is a high-level ethnicity label used by the Canadian Census Bureau and is from the original dataset (https://data.winnipeg.ca/Census/Census-2006-Visible-Minority-Group/n8id-qyur). It is also the definition used in the US, British and pretty much every census in the world (see here https://international.ipums.org/international-action/variables/group?id=ethnic).
To assume that Black refers only the Africans suggests ignorance, to insinuate that the usage of this term by a Brit is in some way bigoted confirms it.
I guess your response confirms my point. It’s a thing of mind.
I guess your use of “Chinese”clearly doesn’t refer to people from China and surroundings and I will be happy to know which category of people form Filipino and your other classification. Maybe you might want to check the dates on your links, just the same way it’s not pc to say white you also don’t say black. I guess you missed all that somehow. Basic Geography: Africa is a continent with 47 countries, not a town or country. And to say all ” Blacks” live in the south sound is incorrect. I guess this map business is better left for the experts or better unpublished.
If you’ve got beef with the categorisation of ‘visible minority’ sub-groups in the Canadian population, you should probably take it up with Statistics Canada as they are the people that define the groups. The data are from the 2006 Canadian Census, in this census 12 main visible minority groups were defined (10 clear groups + 2 others): South Asian, Chinese, Black, Filipino, Latin American, Arab, Southeast Asian, West Asian, Korean, Japanese, Multiple visible minority and Visible minority (not included elsewhere). If you’re struggling to comprehend the existence of these groups, then perhaps try looking here: http://www.statcan.gc.ca/tables-tableaux/sum-som/l01/cst01/demo50a-eng.htm or here: http://www.labour.gc.ca/eng/standards_equity/eq/pubs_eq/eedr/2006/profiles/page06.shtml#vm
Now there is some confusion between race, ethnicity and colour in this classification of visible minority groups, but the categories are what they are – as I say, take it up with Statistics Canada if you have a problem with them.
Similarly, the use of ‘Caucasian’ rather than White comes, again, directly from the Canadian Government and then Stats Canada. Visible minorities are defined in the 1995 Employment Equity Act (http://laws-lois.justice.gc.ca/eng/acts/E-5.401/FullText.html) as “persons, other than aboriginal peoples, who are non-Caucasian in race or non-white in colour”. Check out Box 2 here (http://www12.statcan.gc.ca/nhs-enm/2011/as-sa/99-010-x/99-010-x2011001-eng.cfm) to see how Stats Canada have adopted the definition.
These maps make no value judgement in relation to the categories present in the data, merely represent what is there…
Super interesting, not surprising. Not sure if this holds true for today, but growing up coming from a slavic family, I know my family specifically looked to live near other slavic speaking people. If the language one could be modified to included Eng and foreign language, french and foreign lang. Foreign language only I think would be beneficial.