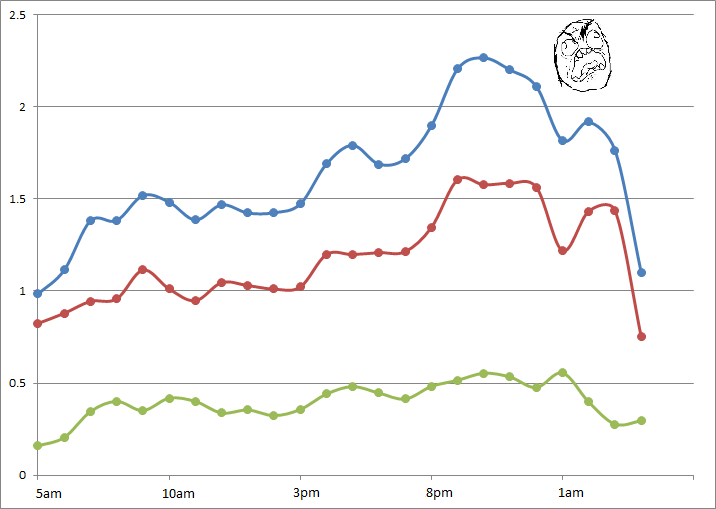
A couple of weeks ago, I put up a post detailing how swearing on Twitter increases during the course of the average day. It seemed people get more angry and sweary outside of work time, rather than during.
To delve a little deeper in this topic, I’ve now had a look at where Twitter gets angry. For each of London’s 33 boroughs I have carried out the same analysis – this time for a month’s worth of tweets – looking at the percentage of tweets containing swear words in each borough. The results follow some interesting trends… 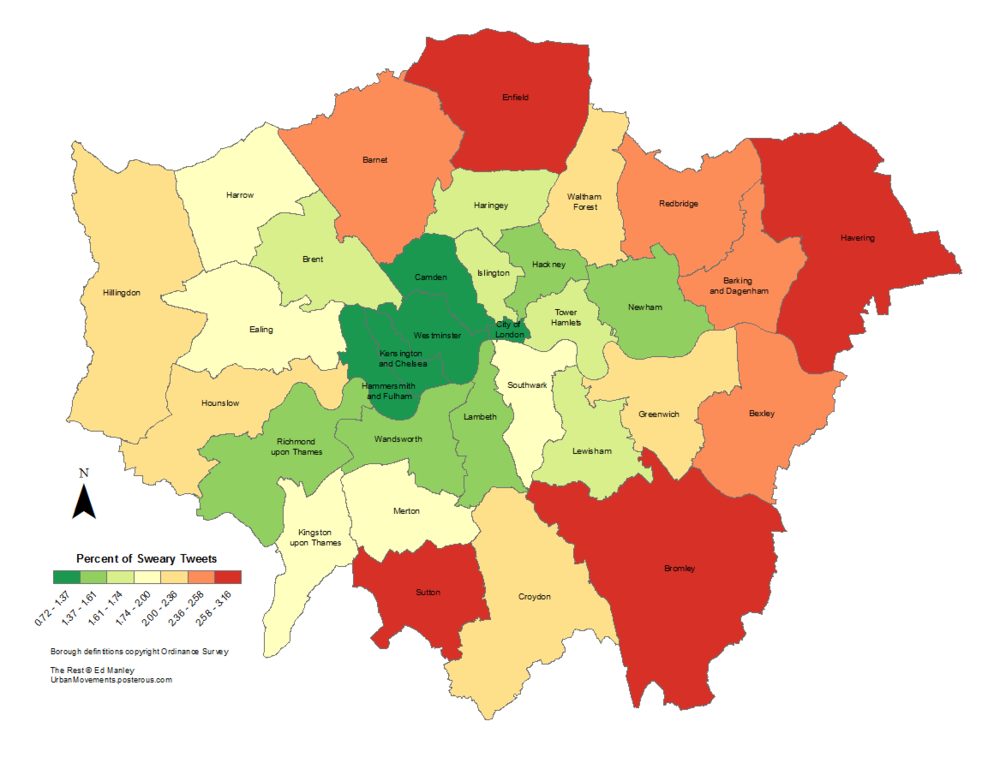
At least in the Twittersphere, inner London appears to be the veritable paradise of civility relative to the bile-filled tweet streams emanating from outer London. The biggest offenders appear to be located to the east of city, with east London fairing considerably worse. Yet the leafy boroughs of Barnet, Sutton and Bromley perform badly too.
Right, so let’s first look at what doesn’t seem to be going on here. First off, the influence of this idea that people mostly swear from the comfort of their own sofa does not seem to hold very true. There does not seem to be a very strong relationship between swearing density and residential locations. If there were then you’d see higher scores in the likes of Haringey, Richmond, Hammersmith and Fulham and Newham. Nor does swearing follow any sort of deprivation index, again Haringey is relatively poor compared to the likes of Sutton, Bromley and Barnet, which fair much worse.
So what is going on?
In my opinion, what I think we are seeing is a reflection of demographic and cultural trends across these boroughs. Taking demography in the first instance, according to the 2009 figures on nationality demographics at the borough level, those London boroughs with the highest percentages of British-born citizens are Havering, Bexley, Bromley and Sutton, respectively*. It would make sense that the higher the percentage of British-born citizens in an area – on average those probably more likely to use an English swear word in a tweet – the greater the number of swearing tweets there are likely to be. True, but I don’t think this tells the whole story.
Looking beyond these four boroughs, Kingston and Richmond also report high percentages of British citizens living within their boundaries – yet we don’t see similar volumes of sweary tweets coming from these boroughs. How can this be so? Make of this what you will, but beyond the demographic variation, the data appears to highlight a cultural variation across London in attitudes towards swearing in tweets. Simply put, the data seems to suggest that the good residents of eastern and southern boroughs of outer London are generally more inclined to throw a swear word into a tweet than their counterparts over to the western side of London.
As I say, this is just my theory – there is a whole lot more you could do to this data to gain a better understanding of the trends observed here (unfortunately I don’t have the time to do so!). I’d be very interested to hear any alternative ideas about what might be going on though.
Overall, I hope these analyses begin to give you an insight into the extent to which Twitter data (and other data sources like it) can be used to reveal and explain social, spatial and temporal trends.
* Newham, Westminster and Kensington and Chelsea score highest for non-British born residents