Identifying Communities in Traffic Flow

One recent bit of research I have been working on has been looking at the application of community detection algorithms to traffic flow in London.

The idea is that within the traffic system exist a number of sub-systems of highly interconnected roads.  To a certain extent, these sub-systems are engineered into the system.  Transport for London, for example, specifically manage and maintain 23 key routes into and around central London, known as ‘corridors’.  However, to what extent do further systems exist outside of these defined zones?

Community detection algorithms were developed to identify clusters within a network dataset.  These methods are most often applied to examples within the social network sphere, in the identification of cliques, where a cluster demonstrates high inter-connectivity, with lower connectivity with the rest of the network.  My thinking behind this bit of work was that we might be able to identify similar characteristics in traffic flow, where we can observed high coupling between clusters of nodes.

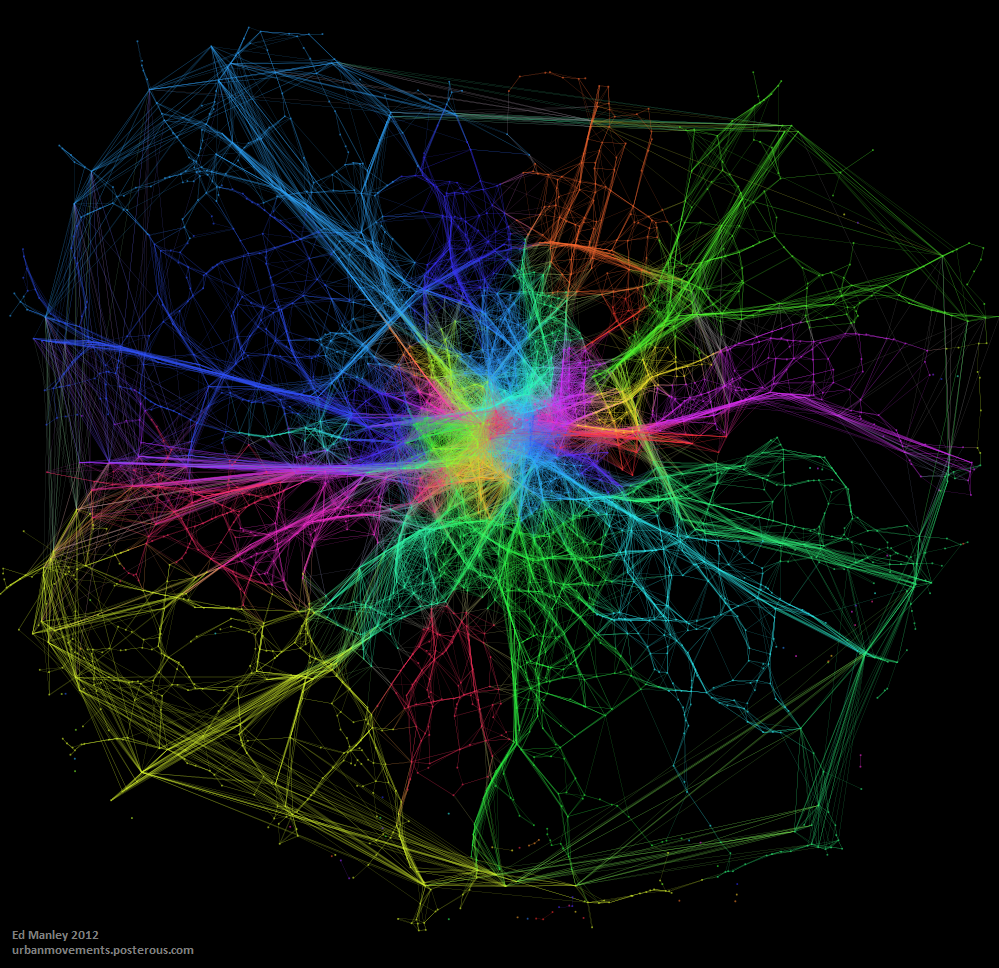
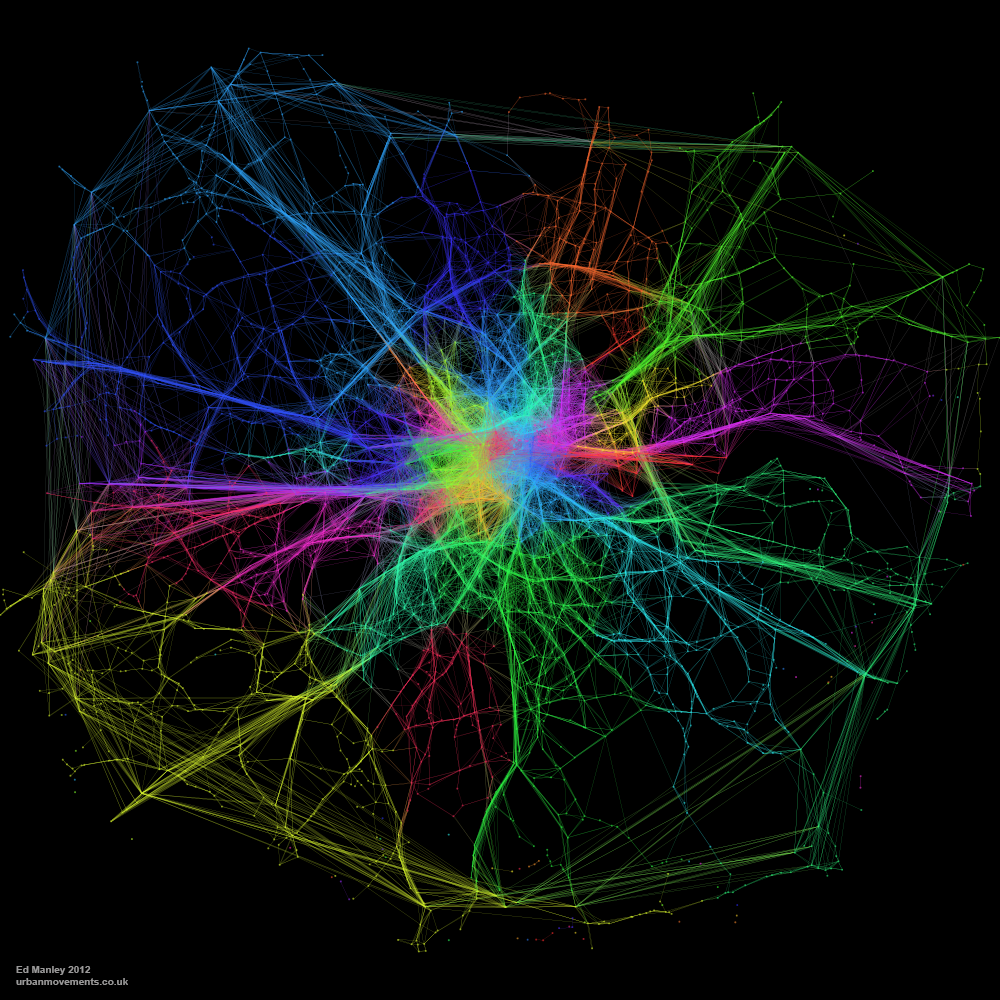
The map below visualises the modules (distinguished by colour) identified through the application of community detection methods to a topological representation of the road network.  Node connectivity is established using a dataset of 1.5 million private hire cab routes through London.

NodeModularity_GrLondon_3_1k_newcred

The resulting visualisation, apart from being quite pretty (thank Gephi for that), reveal some interesting trends.  To a certain extent, a number of expected patterns in traffic flow are prevalent, with some of the ‘corridors’ into central London, such as the M3, M4 and A2, clearly defined as distinct clusters.  Yet the image also shows how both the M25, the ring road around London, and the North Circular, usually considered as single entities, can be segmentalised into modules defined by their usage.

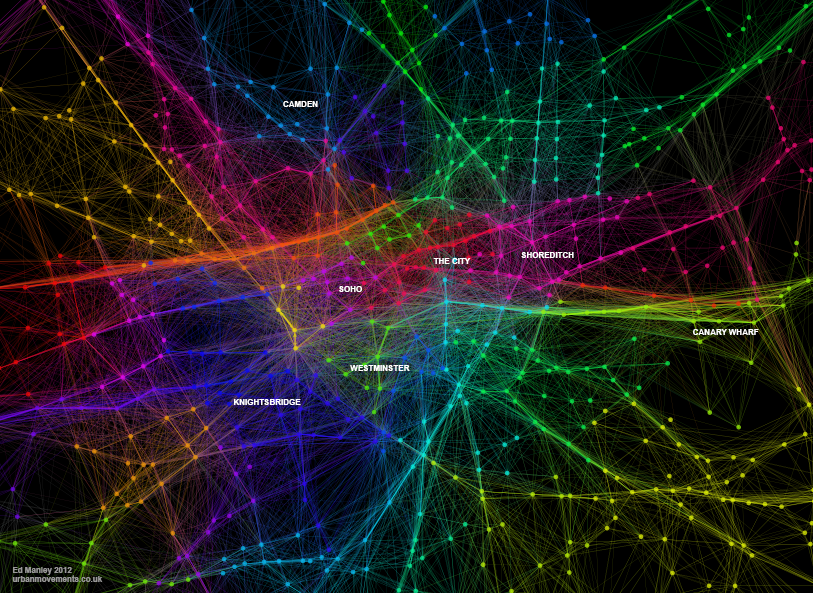
We also see further interesting patterns in central London too, where certain regions – specifically Knightsbridge, Soho, Shoreditch the City and Hyde Park – are clearly defined as distinct modules.  These would appear to be areas of high internal movement, and thus a clear product of cab usage patterns.

These results, while presented only in their initial stages, demonstrate how measures of network characteristics can help us to understand dynamic patterns of movement in the city.


Edit

Thanks to all for the interest in this work!

Just by way of follow up, the image below shows a zoom in on Central London, demonstrating more clearly some of the regions mentioned above.  I’ve annotated this version for people who may not be familiar with London.

CentralLondonModularity_02_annotated


Navigating the City: Minimising Distance but NOT Minimal Distance

I’ve always had a problem with the pervasive assumption in transportation research that everyone takes the shortest metric distance path when travelling between A and B.  This idea doesn’t seem to have any solid foundations in research, and intuitively it doesn’t make much sense – how do you even know what the shortest distance path is anyway?

So a good deal of my research has looked into what people really do. I’m not going to reveal all here – journal papers are generally more important than blogs in assuring future employment – but I’ll share one interesting finding.

The data I have used relates to 700,000 taxi routes through London (you might remember I blogged about this dataset previously).  For each of these routes, between origin and destination, I have also calculated an optimum path, according to a range of metrics, one being distance.  Then, as far as this blog post goes, I have compared each route and calculated the percentage match between the real route and the optimum shortest distance journey.

Realistic?

So is the shortest distance path a decent representation of reality?  No.

On average, the shortest distance path is able to estimate only 39.8% of each route.  Pretty poor when you consider that it is often used solely in predicting the behaviour of many individuals.

Not only this, the data shows that the shortest distance path is followed in entirety only very rare occasions.  Only 5% of real journeys show a match with 90% of their equivalent shortest distance path, with this value only rising to 13% when that threshold is dropped to 75%.

Minimising Distance

So, do people have no consideration for distance when they route through the city?  Well, no, that isn’t quite the case.

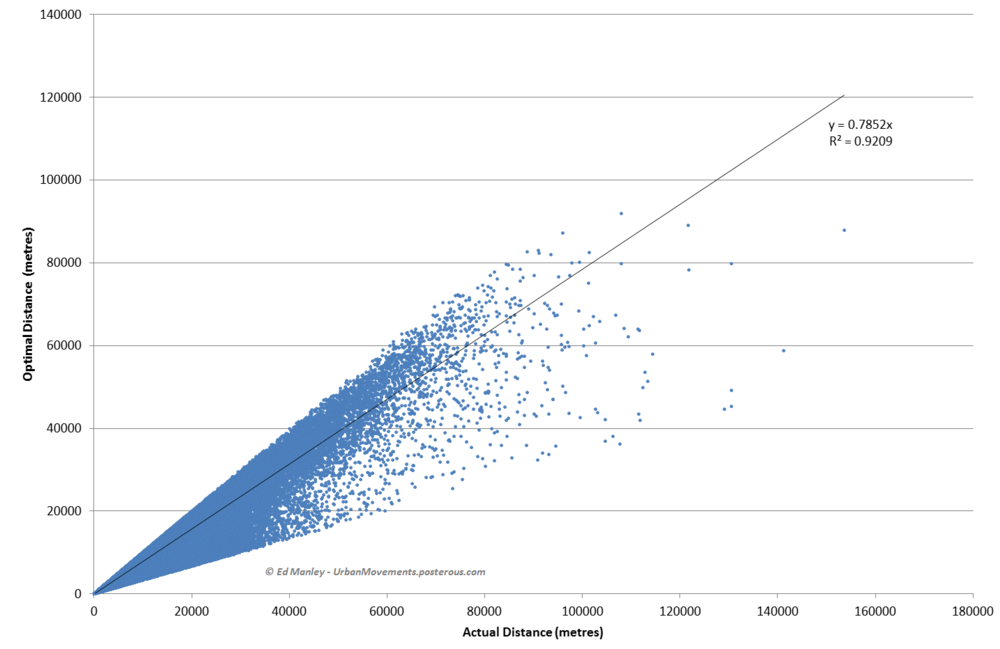
The graph below shows a scatter plot of real distances against actual distances.  As you can see, the relationship and resulting R-square is pretty good.

DistanceVsOptimalAll.PNG.scaled1000

Note: Overly long routes (three times optimal distance) have been removed.

It appears that people therefore appear to minimise distance – or they at least do not at least go extremely far from the minimal – but do not generally take the optimal shortest distance path.

This is research I’m still pulling together, but I hope this post has interest to the wider community.  For anyone that is interested, do get in touch and I’ll let you know when the paper on this may be out.

Modelling Movement in the City: The Influence of Individuals

‘Modelling Movement in the City: The Influence of Individuals’ was the title of a talk I gave at the AGILE conference in Avignon, France last week.  For the conference I actually initially prepared a poster that never ended up seeing the light of day – except for now that is.

The poster presents some recent work I carried out through agent-based simulation, demonstrating how different behavioural models influence the formation of macroscopic patterns.  As you can see from the results, the impact of mere basic assumptions hold a significant impact upon the unfolding network picture.

[slideshare id=19430885&doc=agileposter-130421150321-phpapp02]

Probably now going to write this up as a journal paper, but hopefully putting the poster up here won’t mess with any copyright stuff – please let me know if it might!

Cities of the Future: Towards Technical or Natural Optimisation?

Amanda Erickson put up a nice, simply visualisation of what life might be like in a future of driverless, automated cars. Check it out.

[vimeo http://vimeo.com/37751380]

Two things sprang to mind while watching this – first, how terrifying this might be for a passenger in one of these cars, and second, haven’t I seen this sort of thing somewhere else before?

Well, yes, I showed the following video in a lecture last month as demonstration of self-organisation.  To me, the patterns look similar – at the higher level you see chaos, but when you observe the actions of individual’s there is usually a rational stream of thought behind the actions they are taking – normally to get to their exit road.  Judge for yourself.

[youtube http://www.youtube.com/watch?v=mr5Gssaxl6g&version=3&hl=en_US]

I think the stark similarity seen between these two videos raise interesting questions about what we consider as progress in the urban realm.  Bare with me as I attempt to explain.

The driverless or automated car is often seen as the natural future of private transportation*, with one of its main benefits being the apparent offer of optimal organisation of traffic flows (e.g. no congestion).  And indeed when look at the first video, everything works and works well, perhaps even optimally.  But then you look at the second video, and you essentially have the same thing, created solely through the activity of individuals.

It is strange therefore that a fully optimised technical system is generally deemed necessary and superior.  When people are left to their own devices, to ‘sort it out between them’, people invariably do.  Traffic in Hanoi is not just the only example of this type of self-organisation – the Internet itself is a creation of human ingenuity.  Following Monderman’s ideas on Shared Space, perhaps all of these traffic regulations, signage and restrictions actually reduce our need to think about what we are doing.  They reduce and remove our ability or will to self-organise, and to the deficit of us all.

So why don’t ‘natural’ answers to technical problems receive a better press?  I suspect it is an issue of trust in the citizen.  That threat that one person may mess up, and mess it up for the rest of us.  Instead of facing the risk and accepting it as part of the solution, we surround ourselves with unnecessary and invasive mechanisms that carry out the task for us.  They may cost a lot of money and not be any better than our current solution, but they feel like progress.  It feels like things are getting better.  So, yes, perhaps automated cars are indeed a thing of the future.

As ever, very interested to hear your thoughts on this.

* I’ve personally never been so sure – mainly because of the safety element, and that fact that many people actually enjoy the process of driving…


From Road Closure to Road Congestion

Much of my work attempts to recreate the macro from the micro.  That is the explanation of large-scale effects through the examination of small-scale behaviours.  I look at how these develop over space and time.

So, more specifically, I look at how road congestion forms in cities and how we, as travellers, all contribute towards it.

As part of my early work on this stuff, I developed a simulation looking at how traveller decisions impact on the flow of traffic in adverse situations.  This consisted of the development of an Agent-based Model (ABM) using the Java-based Repast Simphony framework.  After a fair bit of faffing with Repast (which, I should add, is great although has a considerable learning curve in comparison to some ABM software), I have a model that demonstrates the impact of road closures across a population of driving agents.

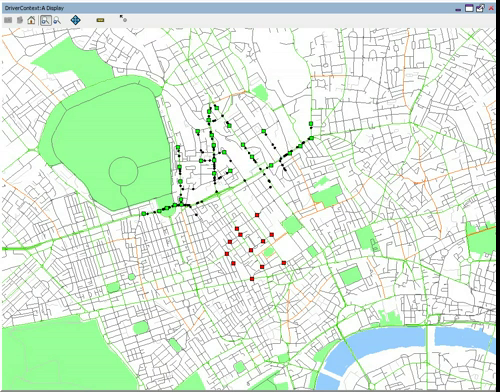
The video below shows how the population of individually-cognating agents move from an area of origins (in green) to an area of destinations (in red) through London.  All of the agents move through geographic space, specifically an area around UCL in Euston.  So, this first video shows the normal situation, the next video will show how that changes once we mess things up a bit. (By the way, the video takes a few seconds to get moving, just allowing me a few seconds of in-lecture explanation).

Although the model is relatively simple in traffic simulation terms (with no traffic lights and regulations etc), I think it does show where concentrations of traffic form.  Particularly through the Euston Road/Tottenham Court Road junction.  So, what would happen if we closed this junction?  This…

I think it’s interesting to see the redistribution in traffic around the network.  Knowing that this junction is closed, you get a lot more movement along other roads suggesting that traffic would be considerably slower in these areas.  Clearly, the exact where’s and when’s in this scenario are some way of what reality might show.  Not only do we not have the impact of road regulations, but each individual holds a perfect knowledge of the network, proceeds towards their target along the shortest path and has prior knowledge of the closure ahead.  These are three important aspects I address in other pieces of work that I’ll put up later.  I also realise a bit of flow data would be quite useful here, but considering the pure conjecture of this scenario I’m not sure it’ll add much!