

One major aspect of my research is spent looking into how people choose their routes around the city. And to aid me in this, I managed to acquire a massive dataset of taxi GPS data from a private hire firm in London. I’ve spent the last few months cleaning up the data, removing errors, deriving probable routes from the point data and extracting route properties.
It’s been a big job, but worth it. I now have the route data of over 700,000 taxi journeys, from exact origin to destination, over the months of December, January and February 2010-11. I’m now moving on to the actual analysis of this data, and am beginning to answer some of these questions concerning real-world route choice. In the meantime, I thought I’d share one striking image that I extracted through this work.
The image below represents an aggregate of journeys on each segment of road on the London road network. The higher levels of flow are illustrated in red, falling to orange, yellow, then white, with the lowest flow values shown in grey.
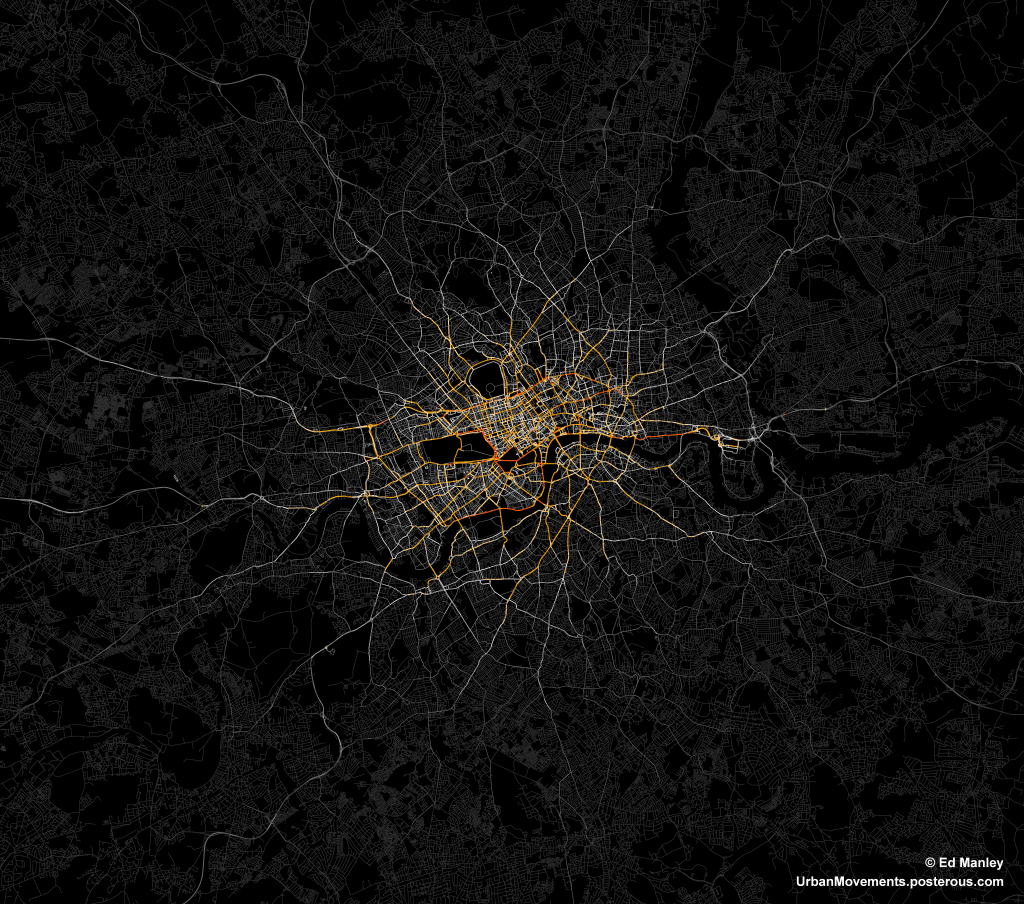
The most popular routes are along Euston Road, Park Lane and Embankment, which may be somewhat expected, but make for a stark constrast with respect to the flow of most traffic in London. The connection with Canary Wharf comes out strongly, an indication of the company’s portfolio, though route choice here is interesting with selection of the The Highway more popular than Commercial Road.
Real insight will come with the full analysis of the route data, something that should be completed in January. Until then, though, I’ll just leave you with this pretty something to look at.