One recent bit of research I have been working on has been looking at the application of community detection algorithms to traffic flow in London.
The idea is that within the traffic system exist a number of sub-systems of highly interconnected roads. To a certain extent, these sub-systems are engineered into the system. Transport for London, for example, specifically manage and maintain 23 key routes into and around central London, known as ‘corridors’. However, to what extent do further systems exist outside of these defined zones?
Community detection algorithms were developed to identify clusters within a network dataset. These methods are most often applied to examples within the social network sphere, in the identification of cliques, where a cluster demonstrates high inter-connectivity, with lower connectivity with the rest of the network. My thinking behind this bit of work was that we might be able to identify similar characteristics in traffic flow, where we can observed high coupling between clusters of nodes.
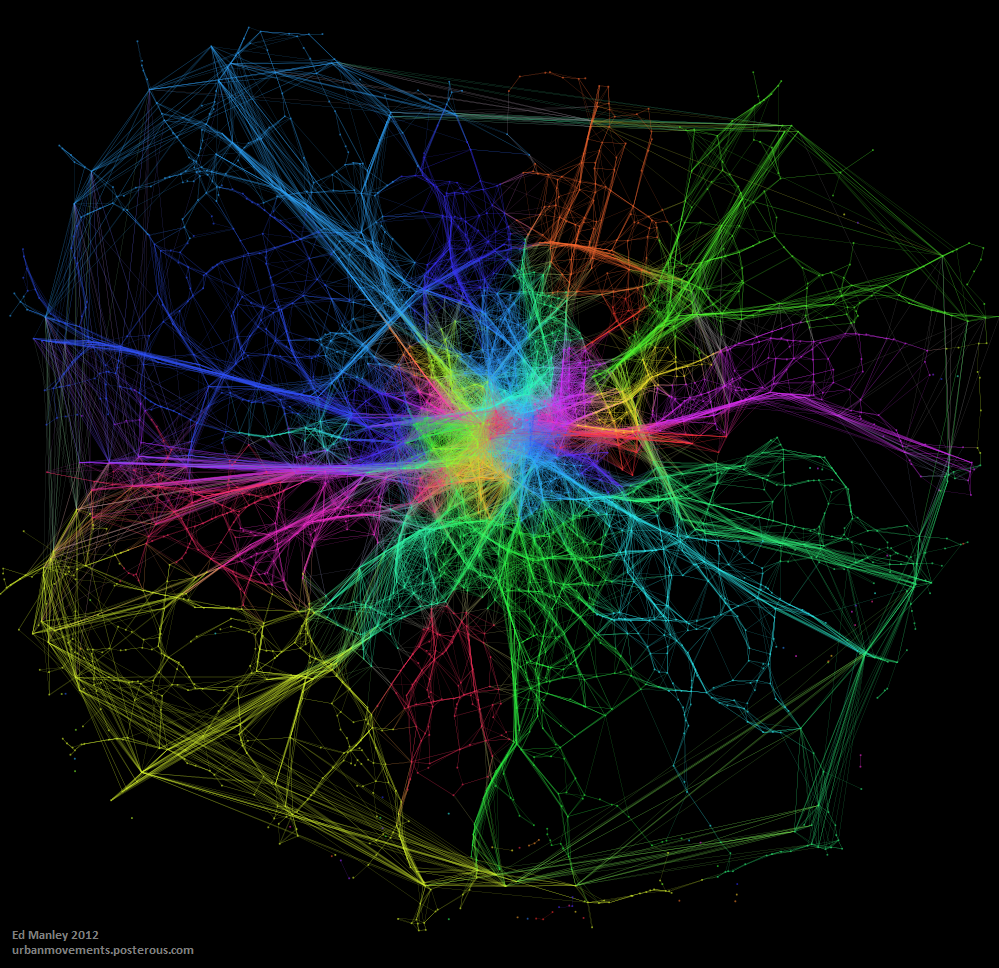
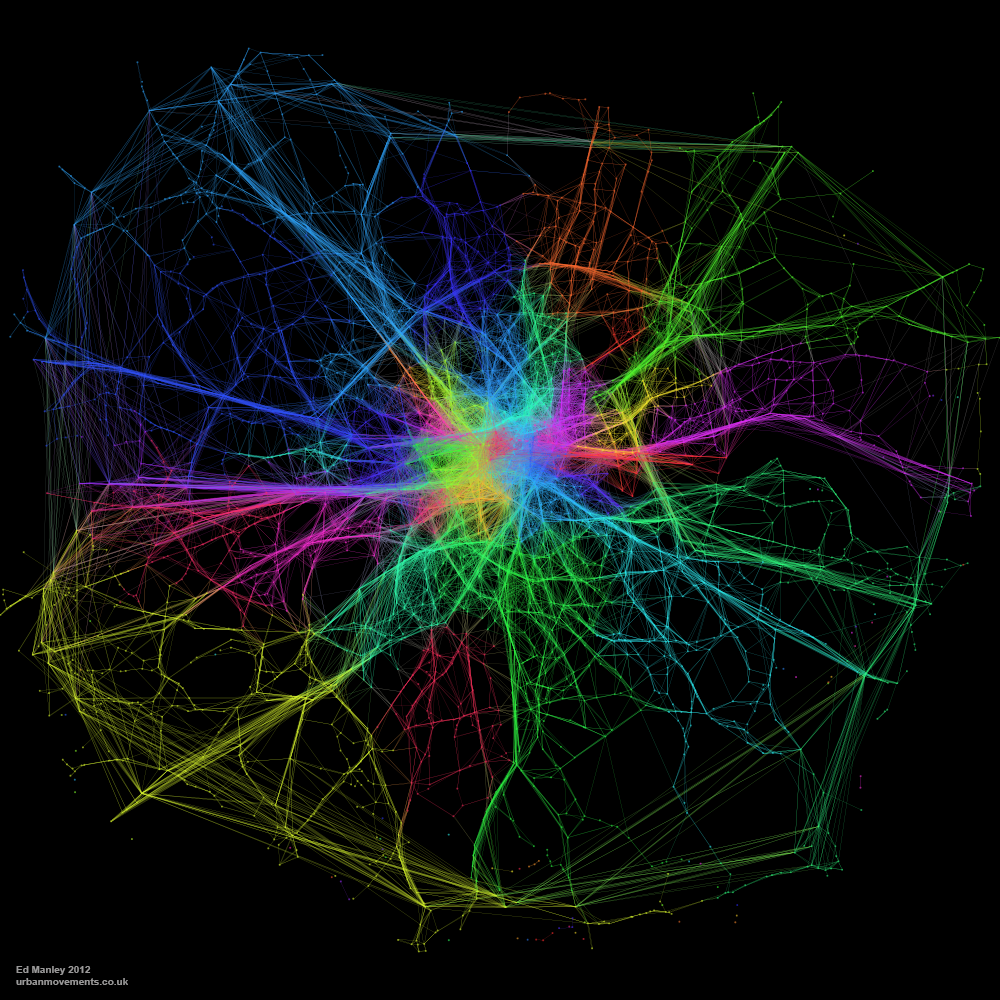
The map below visualises the modules (distinguished by colour) identified through the application of community detection methods to a topological representation of the road network. Node connectivity is established using a dataset of 1.5 million private hire cab routes through London.
The resulting visualisation, apart from being quite pretty (thank Gephi for that), reveal some interesting trends. To a certain extent, a number of expected patterns in traffic flow are prevalent, with some of the ‘corridors’ into central London, such as the M3, M4 and A2, clearly defined as distinct clusters. Yet the image also shows how both the M25, the ring road around London, and the North Circular, usually considered as single entities, can be segmentalised into modules defined by their usage.
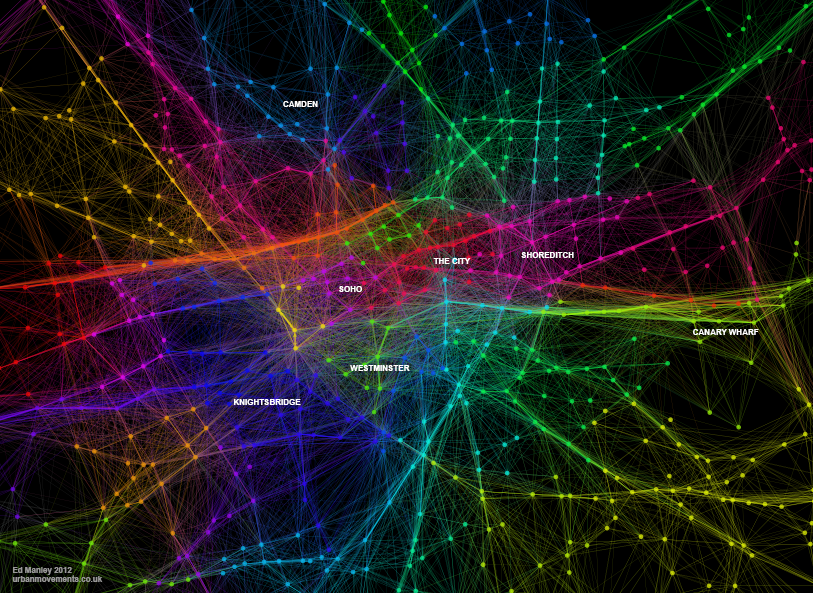
We also see further interesting patterns in central London too, where certain regions – specifically Knightsbridge, Soho, Shoreditch the City and Hyde Park – are clearly defined as distinct modules. These would appear to be areas of high internal movement, and thus a clear product of cab usage patterns.
These results, while presented only in their initial stages, demonstrate how measures of network characteristics can help us to understand dynamic patterns of movement in the city.
Edit
Thanks to all for the interest in this work!
Just by way of follow up, the image below shows a zoom in on Central London, demonstrating more clearly some of the regions mentioned above. I’ve annotated this version for people who may not be familiar with London.


What do the colours mean?Looking at the close-up, Maida Vale, Shoreditch and the lower end of Hammersmith seem oddly lit up.
The colours only differentiate between modules. There is no score or measure for each module, so colours are just used to show the boundaries between clusters.
OK, a scale would have been nice.
Excellent concept….
Fascinating and beautiful!